Japanese vs Immigrants from Cameroon Currently Married
COMPARE
Japanese
Immigrants from Cameroon
Currently Married
Currently Married Comparison
Japanese
Immigrants from Cameroon
44.5%
CURRENTLY MARRIED
0.6/ 100
METRIC RATING
244th/ 347
METRIC RANK
44.2%
CURRENTLY MARRIED
0.3/ 100
METRIC RATING
249th/ 347
METRIC RANK
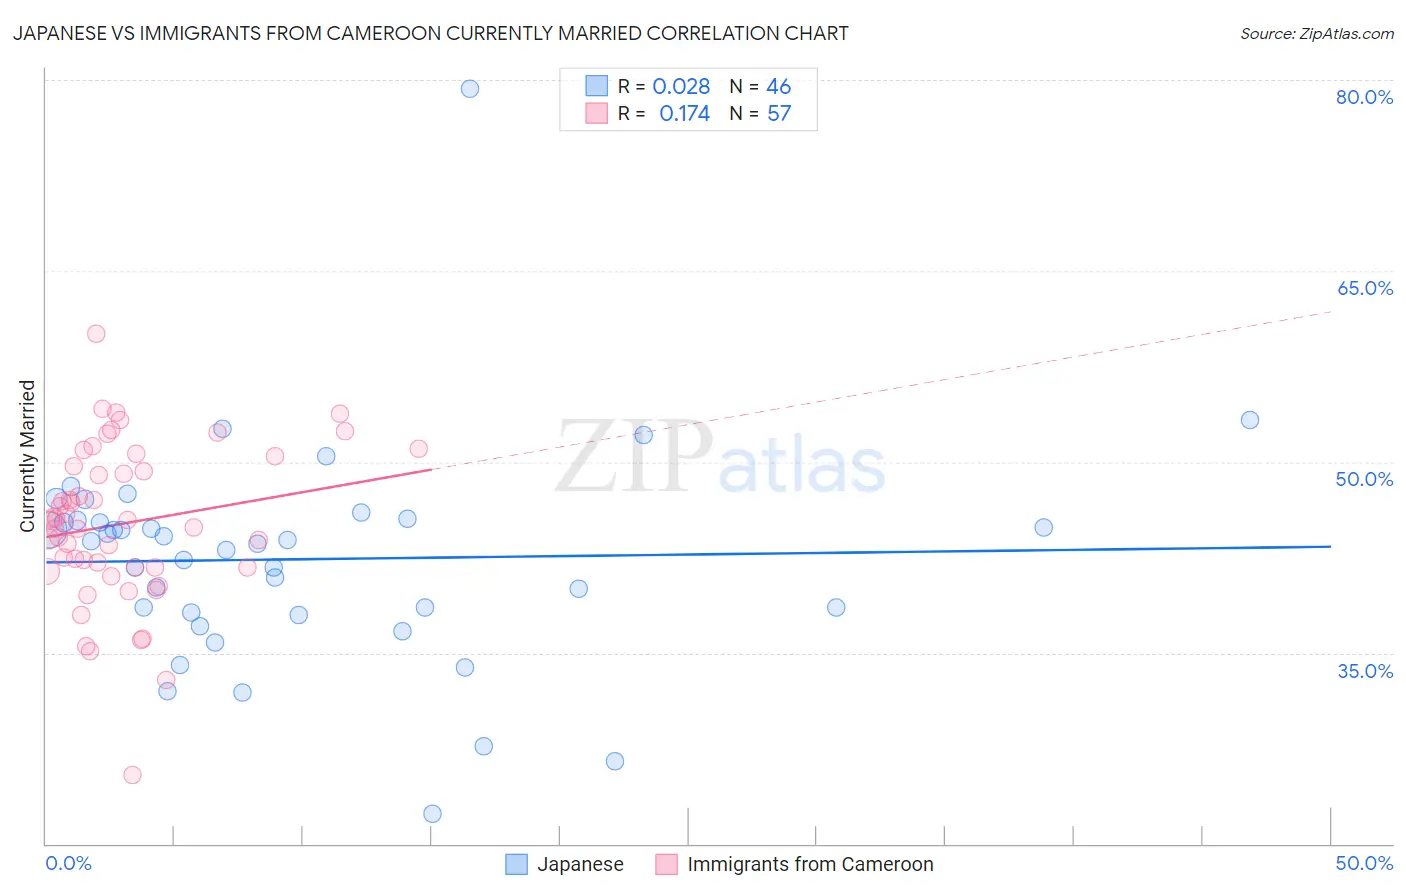
Japanese vs Immigrants from Cameroon Currently Married Correlation Chart
The statistical analysis conducted on geographies consisting of 249,168,550 people shows no correlation between the proportion of Japanese and percentage of population currently married in the United States with a correlation coefficient (R) of 0.028 and weighted average of 44.5%. Similarly, the statistical analysis conducted on geographies consisting of 130,755,125 people shows a poor positive correlation between the proportion of Immigrants from Cameroon and percentage of population currently married in the United States with a correlation coefficient (R) of 0.174 and weighted average of 44.2%, a difference of 0.61%.
Currently Married Correlation Summary
| Measurement | Japanese | Immigrants from Cameroon |
| Minimum | 22.4% | 25.4% |
| Maximum | 79.3% | 60.1% |
| Range | 56.9% | 34.7% |
| Mean | 42.3% | 45.2% |
| Median | 43.7% | 45.4% |
| Interquartile 25% (IQ1) | 38.2% | 41.7% |
| Interquartile 75% (IQ3) | 45.4% | 50.0% |
| Interquartile Range (IQR) | 7.2% | 8.3% |
| Standard Deviation (Sample) | 8.6% | 6.2% |
| Standard Deviation (Population) | 8.6% | 6.1% |
Demographics Similar to Japanese and Immigrants from Cameroon by Currently Married
In terms of currently married, the demographic groups most similar to Japanese are Immigrants from Ethiopia (44.5%, a difference of 0.070%), Immigrants from Cambodia (44.5%, a difference of 0.090%), Ethiopian (44.5%, a difference of 0.12%), Immigrants from Mexico (44.5%, a difference of 0.18%), and Mexican American Indian (44.5%, a difference of 0.18%). Similarly, the demographic groups most similar to Immigrants from Cameroon are Nicaraguan (44.2%, a difference of 0.020%), Immigrants from Eastern Africa (44.2%, a difference of 0.020%), Blackfeet (44.2%, a difference of 0.080%), Ugandan (44.2%, a difference of 0.10%), and Hispanic or Latino (44.1%, a difference of 0.11%).
| Demographics | Rating | Rank | Currently Married |
| Cubans | 0.9 /100 | #236 | Tragic 44.6% |
| Seminole | 0.9 /100 | #237 | Tragic 44.6% |
| Moroccans | 0.9 /100 | #238 | Tragic 44.6% |
| Immigrants | Mexico | 0.7 /100 | #239 | Tragic 44.5% |
| Mexican American Indians | 0.7 /100 | #240 | Tragic 44.5% |
| Ethiopians | 0.7 /100 | #241 | Tragic 44.5% |
| Immigrants | Cambodia | 0.7 /100 | #242 | Tragic 44.5% |
| Immigrants | Ethiopia | 0.7 /100 | #243 | Tragic 44.5% |
| Japanese | 0.6 /100 | #244 | Tragic 44.5% |
| Immigrants | Armenia | 0.4 /100 | #245 | Tragic 44.3% |
| Immigrants | Burma/Myanmar | 0.4 /100 | #246 | Tragic 44.3% |
| Ugandans | 0.4 /100 | #247 | Tragic 44.2% |
| Nicaraguans | 0.3 /100 | #248 | Tragic 44.2% |
| Immigrants | Cameroon | 0.3 /100 | #249 | Tragic 44.2% |
| Immigrants | Eastern Africa | 0.3 /100 | #250 | Tragic 44.2% |
| Blackfeet | 0.3 /100 | #251 | Tragic 44.2% |
| Hispanics or Latinos | 0.3 /100 | #252 | Tragic 44.1% |
| Immigrants | Central America | 0.3 /100 | #253 | Tragic 44.1% |
| Vietnamese | 0.2 /100 | #254 | Tragic 44.0% |
| Yakama | 0.2 /100 | #255 | Tragic 44.0% |
| Shoshone | 0.2 /100 | #256 | Tragic 44.0% |