Japanese vs Navajo Currently Married
COMPARE
Japanese
Navajo
Currently Married
Currently Married Comparison
Japanese
Navajo
44.5%
CURRENTLY MARRIED
0.6/ 100
METRIC RATING
244th/ 347
METRIC RANK
39.0%
CURRENTLY MARRIED
0.0/ 100
METRIC RATING
341st/ 347
METRIC RANK
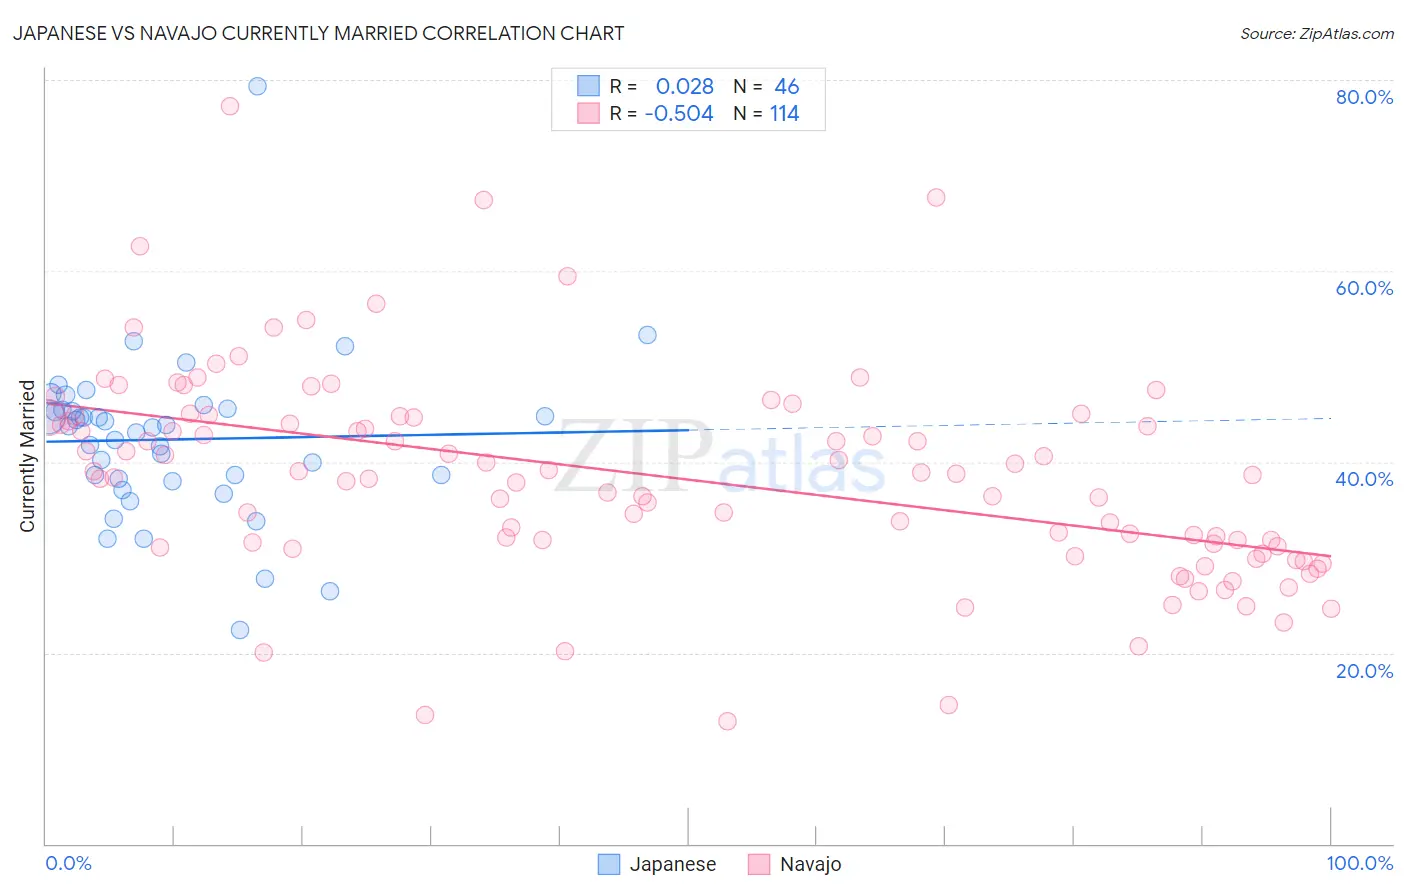
Japanese vs Navajo Currently Married Correlation Chart
The statistical analysis conducted on geographies consisting of 249,168,550 people shows no correlation between the proportion of Japanese and percentage of population currently married in the United States with a correlation coefficient (R) of 0.028 and weighted average of 44.5%. Similarly, the statistical analysis conducted on geographies consisting of 224,862,150 people shows a substantial negative correlation between the proportion of Navajo and percentage of population currently married in the United States with a correlation coefficient (R) of -0.504 and weighted average of 39.0%, a difference of 14.0%.
Currently Married Correlation Summary
| Measurement | Japanese | Navajo |
| Minimum | 22.4% | 12.8% |
| Maximum | 79.3% | 77.3% |
| Range | 56.9% | 64.5% |
| Mean | 42.3% | 38.4% |
| Median | 43.7% | 38.7% |
| Interquartile 25% (IQ1) | 38.2% | 31.1% |
| Interquartile 75% (IQ3) | 45.4% | 44.6% |
| Interquartile Range (IQR) | 7.2% | 13.5% |
| Standard Deviation (Sample) | 8.6% | 10.9% |
| Standard Deviation (Population) | 8.6% | 10.8% |
Similar Demographics by Currently Married
Demographics Similar to Japanese by Currently Married
In terms of currently married, the demographic groups most similar to Japanese are Immigrants from Ethiopia (44.5%, a difference of 0.070%), Immigrants from Cambodia (44.5%, a difference of 0.090%), Ethiopian (44.5%, a difference of 0.12%), Immigrants from Mexico (44.5%, a difference of 0.18%), and Mexican American Indian (44.5%, a difference of 0.18%).
| Demographics | Rating | Rank | Currently Married |
| Seminole | 0.9 /100 | #237 | Tragic 44.6% |
| Moroccans | 0.9 /100 | #238 | Tragic 44.6% |
| Immigrants | Mexico | 0.7 /100 | #239 | Tragic 44.5% |
| Mexican American Indians | 0.7 /100 | #240 | Tragic 44.5% |
| Ethiopians | 0.7 /100 | #241 | Tragic 44.5% |
| Immigrants | Cambodia | 0.7 /100 | #242 | Tragic 44.5% |
| Immigrants | Ethiopia | 0.7 /100 | #243 | Tragic 44.5% |
| Japanese | 0.6 /100 | #244 | Tragic 44.5% |
| Immigrants | Armenia | 0.4 /100 | #245 | Tragic 44.3% |
| Immigrants | Burma/Myanmar | 0.4 /100 | #246 | Tragic 44.3% |
| Ugandans | 0.4 /100 | #247 | Tragic 44.2% |
| Nicaraguans | 0.3 /100 | #248 | Tragic 44.2% |
| Immigrants | Cameroon | 0.3 /100 | #249 | Tragic 44.2% |
| Immigrants | Eastern Africa | 0.3 /100 | #250 | Tragic 44.2% |
| Blackfeet | 0.3 /100 | #251 | Tragic 44.2% |
Demographics Similar to Navajo by Currently Married
In terms of currently married, the demographic groups most similar to Navajo are Immigrants from Dominican Republic (38.9%, a difference of 0.17%), Immigrants from Grenada (39.1%, a difference of 0.35%), Dominican (39.5%, a difference of 1.3%), Cape Verdean (39.6%, a difference of 1.5%), and Black/African American (39.6%, a difference of 1.6%).
| Demographics | Rating | Rank | Currently Married |
| Yup'ik | 0.0 /100 | #333 | Tragic 39.9% |
| Puerto Ricans | 0.0 /100 | #334 | Tragic 39.9% |
| Lumbee | 0.0 /100 | #335 | Tragic 39.8% |
| British West Indians | 0.0 /100 | #336 | Tragic 39.8% |
| Blacks/African Americans | 0.0 /100 | #337 | Tragic 39.6% |
| Cape Verdeans | 0.0 /100 | #338 | Tragic 39.6% |
| Dominicans | 0.0 /100 | #339 | Tragic 39.5% |
| Immigrants | Grenada | 0.0 /100 | #340 | Tragic 39.1% |
| Navajo | 0.0 /100 | #341 | Tragic 39.0% |
| Immigrants | Dominican Republic | 0.0 /100 | #342 | Tragic 38.9% |
| Pueblo | 0.0 /100 | #343 | Tragic 38.2% |
| Immigrants | Cabo Verde | 0.0 /100 | #344 | Tragic 37.8% |
| Tohono O'odham | 0.0 /100 | #345 | Tragic 36.8% |
| Hopi | 0.0 /100 | #346 | Tragic 36.5% |
| Pima | 0.0 /100 | #347 | Tragic 35.9% |