Arapaho vs Spanish American Divorced or Separated
COMPARE
Arapaho
Spanish American
Divorced or Separated
Divorced or Separated Comparison
Arapaho
Spanish Americans
14.8%
DIVORCED OR SEPARATED
0.0/ 100
METRIC RATING
346th/ 347
METRIC RANK
13.3%
DIVORCED OR SEPARATED
0.0/ 100
METRIC RATING
315th/ 347
METRIC RANK
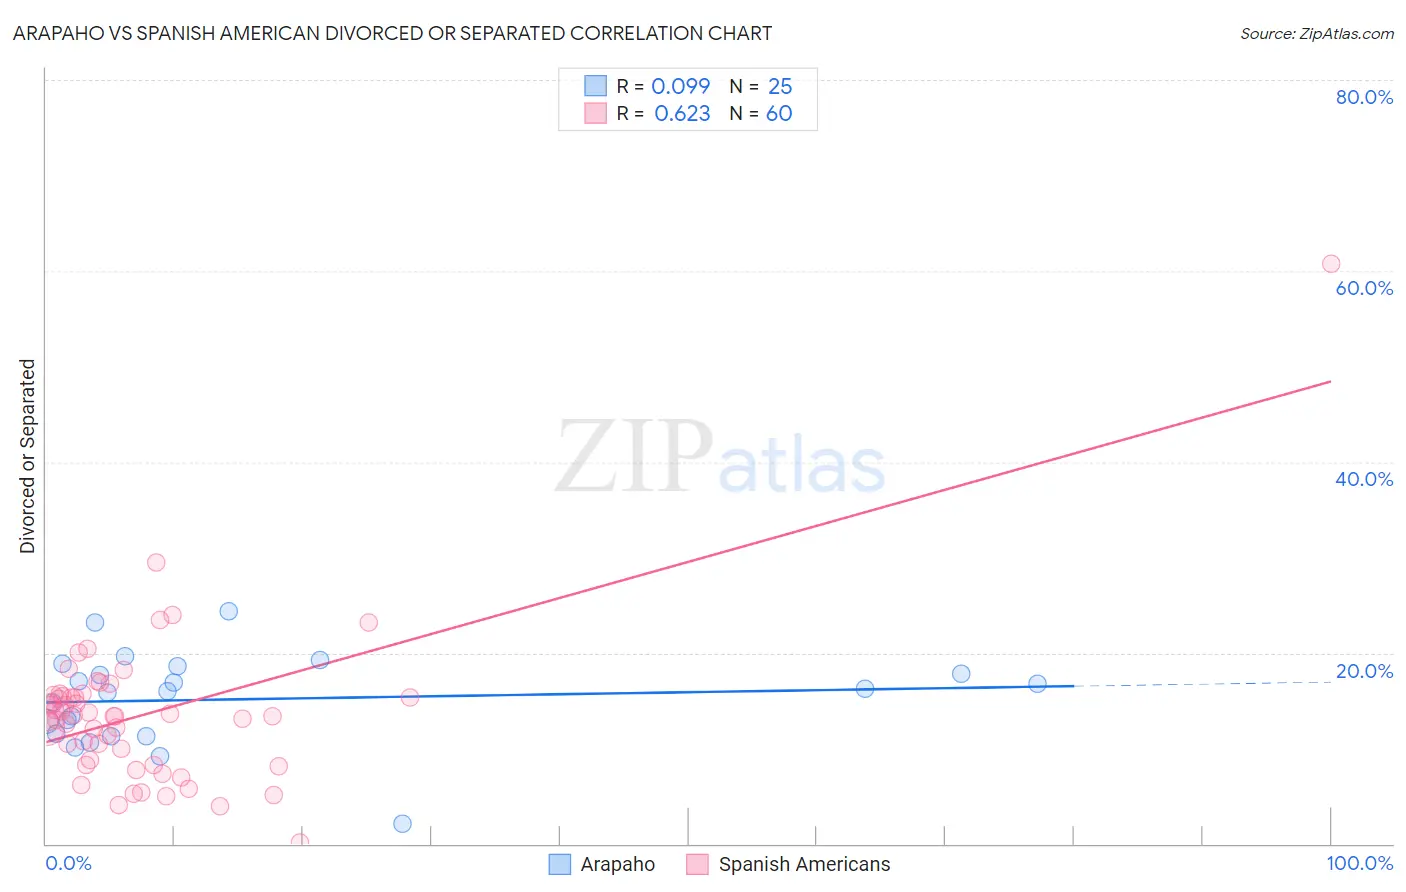
Arapaho vs Spanish American Divorced or Separated Correlation Chart
The statistical analysis conducted on geographies consisting of 29,779,242 people shows a slight positive correlation between the proportion of Arapaho and percentage of population currently divorced or separated in the United States with a correlation coefficient (R) of 0.099 and weighted average of 14.8%. Similarly, the statistical analysis conducted on geographies consisting of 103,168,591 people shows a significant positive correlation between the proportion of Spanish Americans and percentage of population currently divorced or separated in the United States with a correlation coefficient (R) of 0.623 and weighted average of 13.3%, a difference of 11.1%.
Divorced or Separated Correlation Summary
| Measurement | Arapaho | Spanish American |
| Minimum | 2.1% | 0.10% |
| Maximum | 24.4% | 60.7% |
| Range | 22.3% | 60.6% |
| Mean | 15.1% | 13.6% |
| Median | 15.9% | 13.4% |
| Interquartile 25% (IQ1) | 11.4% | 8.5% |
| Interquartile 75% (IQ3) | 18.2% | 15.6% |
| Interquartile Range (IQR) | 6.8% | 7.0% |
| Standard Deviation (Sample) | 4.8% | 8.2% |
| Standard Deviation (Population) | 4.7% | 8.2% |
Similar Demographics by Divorced or Separated
Demographics Similar to Arapaho by Divorced or Separated
In terms of divorced or separated, the demographic groups most similar to Arapaho are Kiowa (14.5%, a difference of 2.1%), Cuban (14.5%, a difference of 2.2%), Immigrants from Cuba (15.2%, a difference of 2.8%), Creek (14.4%, a difference of 2.9%), and Seminole (14.3%, a difference of 3.9%).
| Demographics | Rating | Rank | Divorced or Separated |
| Puerto Ricans | 0.0 /100 | #333 | Tragic 13.9% |
| Immigrants | Bahamas | 0.0 /100 | #334 | Tragic 13.9% |
| Dutch West Indians | 0.0 /100 | #335 | Tragic 14.0% |
| Shoshone | 0.0 /100 | #336 | Tragic 14.0% |
| Crow | 0.0 /100 | #337 | Tragic 14.1% |
| Choctaw | 0.0 /100 | #338 | Tragic 14.1% |
| Colville | 0.0 /100 | #339 | Tragic 14.2% |
| Chickasaw | 0.0 /100 | #340 | Tragic 14.2% |
| Bahamians | 0.0 /100 | #341 | Tragic 14.2% |
| Seminole | 0.0 /100 | #342 | Tragic 14.3% |
| Creek | 0.0 /100 | #343 | Tragic 14.4% |
| Cubans | 0.0 /100 | #344 | Tragic 14.5% |
| Kiowa | 0.0 /100 | #345 | Tragic 14.5% |
| Arapaho | 0.0 /100 | #346 | Tragic 14.8% |
| Immigrants | Cuba | 0.0 /100 | #347 | Tragic 15.2% |
Demographics Similar to Spanish Americans by Divorced or Separated
In terms of divorced or separated, the demographic groups most similar to Spanish Americans are Tsimshian (13.3%, a difference of 0.030%), Haitian (13.3%, a difference of 0.050%), Cree (13.4%, a difference of 0.080%), Puget Sound Salish (13.4%, a difference of 0.12%), and Cajun (13.4%, a difference of 0.18%).
| Demographics | Rating | Rank | Divorced or Separated |
| Ottawa | 0.0 /100 | #308 | Tragic 13.2% |
| Americans | 0.0 /100 | #309 | Tragic 13.2% |
| Africans | 0.0 /100 | #310 | Tragic 13.2% |
| Sioux | 0.0 /100 | #311 | Tragic 13.2% |
| Blackfeet | 0.0 /100 | #312 | Tragic 13.3% |
| Immigrants | Nicaragua | 0.0 /100 | #313 | Tragic 13.3% |
| Yaqui | 0.0 /100 | #314 | Tragic 13.3% |
| Spanish Americans | 0.0 /100 | #315 | Tragic 13.3% |
| Tsimshian | 0.0 /100 | #316 | Tragic 13.3% |
| Haitians | 0.0 /100 | #317 | Tragic 13.3% |
| Cree | 0.0 /100 | #318 | Tragic 13.4% |
| Puget Sound Salish | 0.0 /100 | #319 | Tragic 13.4% |
| Cajuns | 0.0 /100 | #320 | Tragic 13.4% |
| Cheyenne | 0.0 /100 | #321 | Tragic 13.4% |
| Immigrants | Haiti | 0.0 /100 | #322 | Tragic 13.4% |