Jamaican vs Spanish American 3rd Grade
COMPARE
Jamaican
Spanish American
3rd Grade
3rd Grade Comparison
Jamaicans
Spanish Americans
97.4%
3RD GRADE
0.7/ 100
METRIC RATING
254th/ 347
METRIC RANK
97.8%
3RD GRADE
51.8/ 100
METRIC RATING
172nd/ 347
METRIC RANK
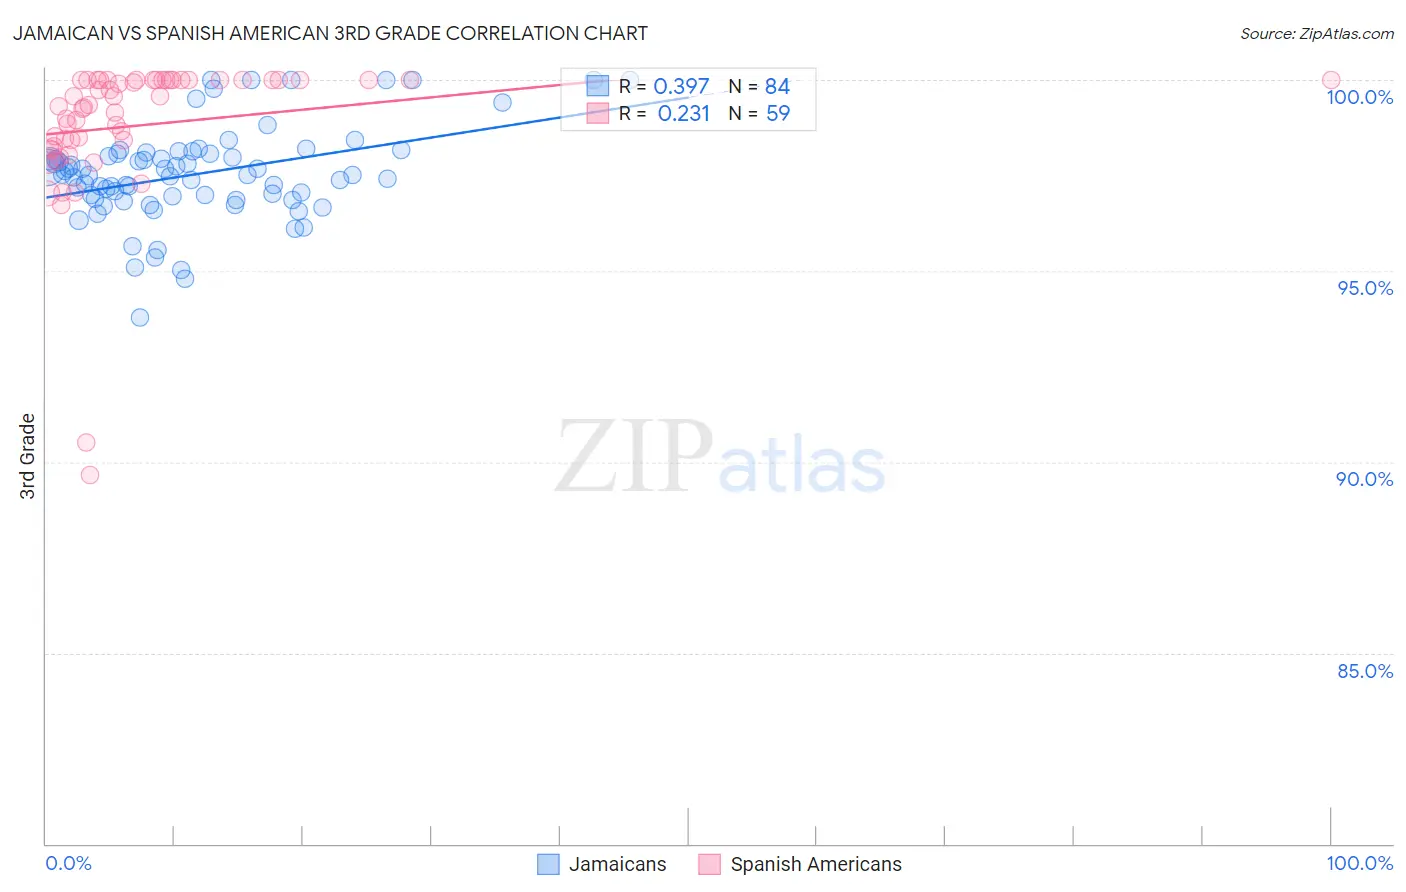
Jamaican vs Spanish American 3rd Grade Correlation Chart
The statistical analysis conducted on geographies consisting of 368,084,189 people shows a mild positive correlation between the proportion of Jamaicans and percentage of population with at least 3rd grade education in the United States with a correlation coefficient (R) of 0.397 and weighted average of 97.4%. Similarly, the statistical analysis conducted on geographies consisting of 103,168,542 people shows a weak positive correlation between the proportion of Spanish Americans and percentage of population with at least 3rd grade education in the United States with a correlation coefficient (R) of 0.231 and weighted average of 97.8%, a difference of 0.42%.
3rd Grade Correlation Summary
| Measurement | Jamaican | Spanish American |
| Minimum | 93.8% | 89.6% |
| Maximum | 100.0% | 100.0% |
| Range | 6.2% | 10.4% |
| Mean | 97.5% | 98.8% |
| Median | 97.5% | 99.3% |
| Interquartile 25% (IQ1) | 96.9% | 98.3% |
| Interquartile 75% (IQ3) | 98.1% | 100.0% |
| Interquartile Range (IQR) | 1.1% | 1.7% |
| Standard Deviation (Sample) | 1.2% | 1.9% |
| Standard Deviation (Population) | 1.2% | 1.9% |
Similar Demographics by 3rd Grade
Demographics Similar to Jamaicans by 3rd Grade
In terms of 3rd grade, the demographic groups most similar to Jamaicans are Immigrants from Middle Africa (97.4%, a difference of 0.010%), Immigrants from Asia (97.4%, a difference of 0.010%), Peruvian (97.4%, a difference of 0.010%), Immigrants from Africa (97.4%, a difference of 0.010%), and Assyrian/Chaldean/Syriac (97.4%, a difference of 0.020%).
| Demographics | Rating | Rank | 3rd Grade |
| Assyrians/Chaldeans/Syriacs | 1.0 /100 | #247 | Tragic 97.4% |
| Immigrants | Eastern Africa | 0.9 /100 | #248 | Tragic 97.4% |
| South Americans | 0.9 /100 | #249 | Tragic 97.4% |
| Immigrants | Middle Africa | 0.9 /100 | #250 | Tragic 97.4% |
| Immigrants | Asia | 0.8 /100 | #251 | Tragic 97.4% |
| Peruvians | 0.8 /100 | #252 | Tragic 97.4% |
| Immigrants | Africa | 0.8 /100 | #253 | Tragic 97.4% |
| Jamaicans | 0.7 /100 | #254 | Tragic 97.4% |
| Bolivians | 0.6 /100 | #255 | Tragic 97.3% |
| Immigrants | Congo | 0.6 /100 | #256 | Tragic 97.3% |
| Immigrants | Colombia | 0.5 /100 | #257 | Tragic 97.3% |
| Immigrants | Liberia | 0.5 /100 | #258 | Tragic 97.3% |
| Armenians | 0.4 /100 | #259 | Tragic 97.3% |
| Immigrants | Ethiopia | 0.4 /100 | #260 | Tragic 97.3% |
| Immigrants | South America | 0.4 /100 | #261 | Tragic 97.3% |
Demographics Similar to Spanish Americans by 3rd Grade
In terms of 3rd grade, the demographic groups most similar to Spanish Americans are Kenyan (97.8%, a difference of 0.0%), Immigrants from Korea (97.8%, a difference of 0.0%), Ugandan (97.8%, a difference of 0.010%), Dutch West Indian (97.8%, a difference of 0.010%), and Chilean (97.8%, a difference of 0.010%).
| Demographics | Rating | Rank | 3rd Grade |
| Ugandans | 56.1 /100 | #165 | Average 97.8% |
| Dutch West Indians | 55.5 /100 | #166 | Average 97.8% |
| Chileans | 55.3 /100 | #167 | Average 97.8% |
| Immigrants | Spain | 54.3 /100 | #168 | Average 97.8% |
| Comanche | 53.8 /100 | #169 | Average 97.8% |
| Brazilians | 53.7 /100 | #170 | Average 97.8% |
| Kenyans | 51.8 /100 | #171 | Average 97.8% |
| Spanish Americans | 51.8 /100 | #172 | Average 97.8% |
| Immigrants | Korea | 50.9 /100 | #173 | Average 97.8% |
| Navajo | 50.0 /100 | #174 | Average 97.8% |
| Immigrants | Micronesia | 47.6 /100 | #175 | Average 97.8% |
| Immigrants | Poland | 47.1 /100 | #176 | Average 97.8% |
| Egyptians | 46.6 /100 | #177 | Average 97.7% |
| Immigrants | Brazil | 46.4 /100 | #178 | Average 97.7% |
| Immigrants | Belarus | 45.9 /100 | #179 | Average 97.7% |