Kiowa vs Guatemalan Divorced or Separated
COMPARE
Kiowa
Guatemalan
Divorced or Separated
Divorced or Separated Comparison
Kiowa
Guatemalans
14.5%
DIVORCED OR SEPARATED
0.0/ 100
METRIC RATING
345th/ 347
METRIC RANK
12.2%
DIVORCED OR SEPARATED
26.9/ 100
METRIC RATING
201st/ 347
METRIC RANK
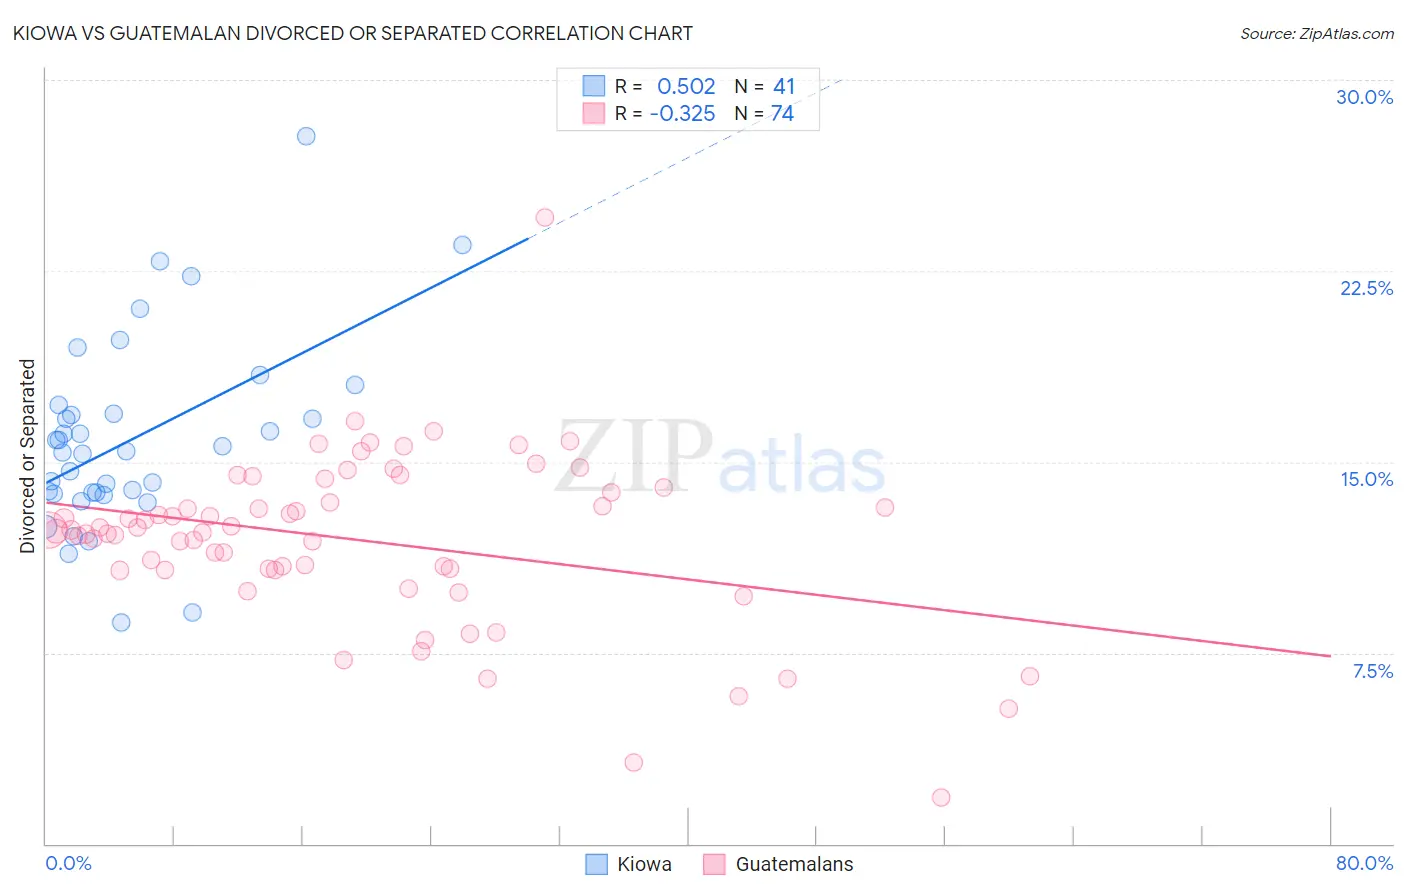
Kiowa vs Guatemalan Divorced or Separated Correlation Chart
The statistical analysis conducted on geographies consisting of 56,101,840 people shows a substantial positive correlation between the proportion of Kiowa and percentage of population currently divorced or separated in the United States with a correlation coefficient (R) of 0.502 and weighted average of 14.5%. Similarly, the statistical analysis conducted on geographies consisting of 409,404,182 people shows a mild negative correlation between the proportion of Guatemalans and percentage of population currently divorced or separated in the United States with a correlation coefficient (R) of -0.325 and weighted average of 12.2%, a difference of 19.4%.
Divorced or Separated Correlation Summary
| Measurement | Kiowa | Guatemalan |
| Minimum | 8.7% | 1.8% |
| Maximum | 27.8% | 24.6% |
| Range | 19.1% | 22.8% |
| Mean | 15.9% | 11.9% |
| Median | 15.4% | 12.3% |
| Interquartile 25% (IQ1) | 13.8% | 10.8% |
| Interquartile 75% (IQ3) | 17.1% | 13.8% |
| Interquartile Range (IQR) | 3.3% | 3.0% |
| Standard Deviation (Sample) | 3.8% | 3.4% |
| Standard Deviation (Population) | 3.7% | 3.3% |
Similar Demographics by Divorced or Separated
Demographics Similar to Kiowa by Divorced or Separated
In terms of divorced or separated, the demographic groups most similar to Kiowa are Cuban (14.5%, a difference of 0.10%), Creek (14.4%, a difference of 0.77%), Seminole (14.3%, a difference of 1.8%), Bahamian (14.2%, a difference of 2.0%), and Arapaho (14.8%, a difference of 2.1%).
| Demographics | Rating | Rank | Divorced or Separated |
| Puerto Ricans | 0.0 /100 | #333 | Tragic 13.9% |
| Immigrants | Bahamas | 0.0 /100 | #334 | Tragic 13.9% |
| Dutch West Indians | 0.0 /100 | #335 | Tragic 14.0% |
| Shoshone | 0.0 /100 | #336 | Tragic 14.0% |
| Crow | 0.0 /100 | #337 | Tragic 14.1% |
| Choctaw | 0.0 /100 | #338 | Tragic 14.1% |
| Colville | 0.0 /100 | #339 | Tragic 14.2% |
| Chickasaw | 0.0 /100 | #340 | Tragic 14.2% |
| Bahamians | 0.0 /100 | #341 | Tragic 14.2% |
| Seminole | 0.0 /100 | #342 | Tragic 14.3% |
| Creek | 0.0 /100 | #343 | Tragic 14.4% |
| Cubans | 0.0 /100 | #344 | Tragic 14.5% |
| Kiowa | 0.0 /100 | #345 | Tragic 14.5% |
| Arapaho | 0.0 /100 | #346 | Tragic 14.8% |
| Immigrants | Cuba | 0.0 /100 | #347 | Tragic 15.2% |
Demographics Similar to Guatemalans by Divorced or Separated
In terms of divorced or separated, the demographic groups most similar to Guatemalans are South American (12.2%, a difference of 0.070%), Central American (12.1%, a difference of 0.10%), Nigerian (12.1%, a difference of 0.14%), Immigrants from Burma/Myanmar (12.1%, a difference of 0.15%), and Immigrants from Africa (12.1%, a difference of 0.15%).
| Demographics | Rating | Rank | Divorced or Separated |
| Immigrants | Eritrea | 31.9 /100 | #194 | Fair 12.1% |
| Immigrants | England | 31.4 /100 | #195 | Fair 12.1% |
| Immigrants | Burma/Myanmar | 30.4 /100 | #196 | Fair 12.1% |
| Immigrants | Africa | 30.3 /100 | #197 | Fair 12.1% |
| Nigerians | 30.1 /100 | #198 | Fair 12.1% |
| Central Americans | 29.4 /100 | #199 | Fair 12.1% |
| South Americans | 28.6 /100 | #200 | Fair 12.2% |
| Guatemalans | 26.9 /100 | #201 | Fair 12.2% |
| Portuguese | 23.5 /100 | #202 | Fair 12.2% |
| Immigrants | Guatemala | 23.2 /100 | #203 | Fair 12.2% |
| Kenyans | 21.8 /100 | #204 | Fair 12.2% |
| Immigrants | Costa Rica | 21.3 /100 | #205 | Fair 12.2% |
| Slovaks | 21.0 /100 | #206 | Fair 12.2% |
| Mexicans | 21.0 /100 | #207 | Fair 12.2% |
| Immigrants | Ghana | 18.8 /100 | #208 | Poor 12.2% |