Jamaican vs Guatemalan 1 or more Vehicles in Household
COMPARE
Jamaican
Guatemalan
1 or more Vehicles in Household
1 or more Vehicles in Household Comparison
Jamaicans
Guatemalans
82.1%
1 OR MORE VEHICLES IN HOUSEHOLD
0.0/ 100
METRIC RATING
321st/ 347
METRIC RANK
89.2%
1 OR MORE VEHICLES IN HOUSEHOLD
17.8/ 100
METRIC RATING
205th/ 347
METRIC RANK
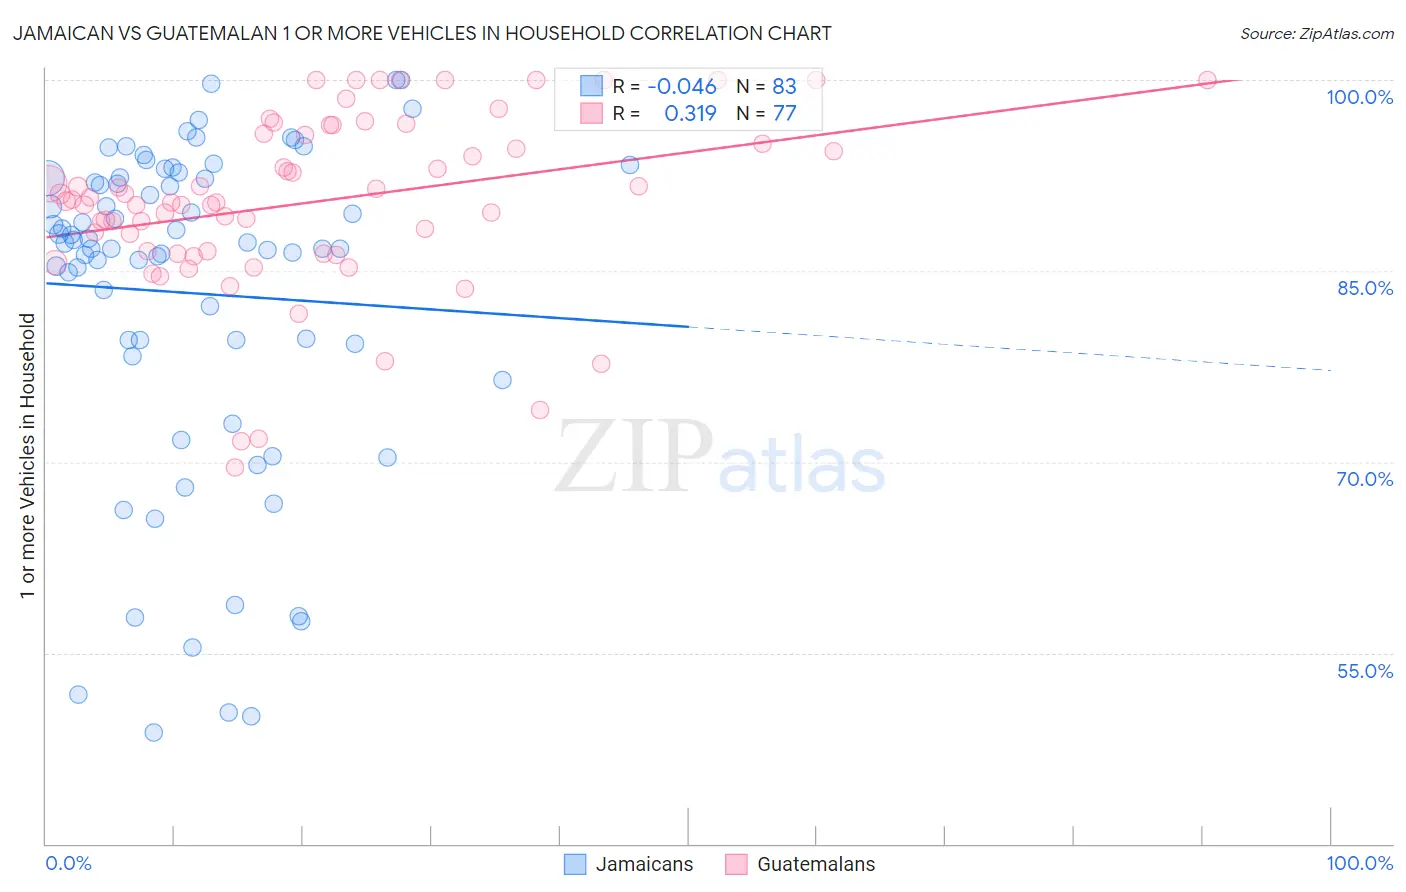
Jamaican vs Guatemalan 1 or more Vehicles in Household Correlation Chart
The statistical analysis conducted on geographies consisting of 367,719,271 people shows no correlation between the proportion of Jamaicans and percentage of households with 1 or more vehicles available in the United States with a correlation coefficient (R) of -0.046 and weighted average of 82.1%. Similarly, the statistical analysis conducted on geographies consisting of 409,296,484 people shows a mild positive correlation between the proportion of Guatemalans and percentage of households with 1 or more vehicles available in the United States with a correlation coefficient (R) of 0.319 and weighted average of 89.2%, a difference of 8.5%.
1 or more Vehicles in Household Correlation Summary
| Measurement | Jamaican | Guatemalan |
| Minimum | 48.7% | 69.6% |
| Maximum | 100.0% | 100.0% |
| Range | 51.3% | 30.4% |
| Mean | 83.3% | 90.4% |
| Median | 87.2% | 90.4% |
| Interquartile 25% (IQ1) | 79.3% | 86.5% |
| Interquartile 75% (IQ3) | 92.3% | 95.7% |
| Interquartile Range (IQR) | 13.0% | 9.3% |
| Standard Deviation (Sample) | 13.0% | 6.9% |
| Standard Deviation (Population) | 12.9% | 6.8% |
Similar Demographics by 1 or more Vehicles in Household
Demographics Similar to Jamaicans by 1 or more Vehicles in Household
In terms of 1 or more vehicles in household, the demographic groups most similar to Jamaicans are Soviet Union (82.7%, a difference of 0.64%), Immigrants from Cabo Verde (81.6%, a difference of 0.67%), Immigrants from Belarus (83.3%, a difference of 1.5%), Immigrants from Ghana (83.4%, a difference of 1.6%), and Ghanaian (83.6%, a difference of 1.8%).
| Demographics | Rating | Rank | 1 or more Vehicles in Household |
| Albanians | 0.0 /100 | #314 | Tragic 84.4% |
| Cypriots | 0.0 /100 | #315 | Tragic 84.4% |
| Alaska Natives | 0.0 /100 | #316 | Tragic 83.8% |
| Ghanaians | 0.0 /100 | #317 | Tragic 83.6% |
| Immigrants | Ghana | 0.0 /100 | #318 | Tragic 83.4% |
| Immigrants | Belarus | 0.0 /100 | #319 | Tragic 83.3% |
| Soviet Union | 0.0 /100 | #320 | Tragic 82.7% |
| Jamaicans | 0.0 /100 | #321 | Tragic 82.1% |
| Immigrants | Cabo Verde | 0.0 /100 | #322 | Tragic 81.6% |
| Immigrants | Yemen | 0.0 /100 | #323 | Tragic 80.5% |
| Immigrants | Caribbean | 0.0 /100 | #324 | Tragic 80.4% |
| Senegalese | 0.0 /100 | #325 | Tragic 80.4% |
| Immigrants | West Indies | 0.0 /100 | #326 | Tragic 79.5% |
| Immigrants | Senegal | 0.0 /100 | #327 | Tragic 79.0% |
| Ecuadorians | 0.0 /100 | #328 | Tragic 77.9% |
Demographics Similar to Guatemalans by 1 or more Vehicles in Household
In terms of 1 or more vehicles in household, the demographic groups most similar to Guatemalans are Romanian (89.2%, a difference of 0.010%), Cambodian (89.2%, a difference of 0.030%), Iroquois (89.2%, a difference of 0.050%), Apache (89.1%, a difference of 0.050%), and Immigrants from Western Europe (89.2%, a difference of 0.070%).
| Demographics | Rating | Rank | 1 or more Vehicles in Household |
| Pennsylvania Germans | 22.9 /100 | #198 | Fair 89.3% |
| Immigrants | Asia | 22.8 /100 | #199 | Fair 89.3% |
| Central Americans | 21.4 /100 | #200 | Fair 89.2% |
| Immigrants | Western Europe | 20.5 /100 | #201 | Fair 89.2% |
| Iroquois | 19.8 /100 | #202 | Poor 89.2% |
| Cambodians | 18.9 /100 | #203 | Poor 89.2% |
| Romanians | 18.2 /100 | #204 | Poor 89.2% |
| Guatemalans | 17.8 /100 | #205 | Poor 89.2% |
| Apache | 16.2 /100 | #206 | Poor 89.1% |
| Immigrants | Denmark | 14.8 /100 | #207 | Poor 89.1% |
| Immigrants | Chile | 14.4 /100 | #208 | Poor 89.1% |
| Immigrants | Italy | 14.0 /100 | #209 | Poor 89.1% |
| Dutch West Indians | 13.5 /100 | #210 | Poor 89.0% |
| Sierra Leoneans | 13.0 /100 | #211 | Poor 89.0% |
| Somalis | 12.8 /100 | #212 | Poor 89.0% |