Irish vs Immigrants from Malaysia Currently Married
COMPARE
Irish
Immigrants from Malaysia
Currently Married
Currently Married Comparison
Irish
Immigrants from Malaysia
48.9%
CURRENTLY MARRIED
99.5/ 100
METRIC RATING
33rd/ 347
METRIC RANK
47.3%
CURRENTLY MARRIED
81.1/ 100
METRIC RATING
133rd/ 347
METRIC RANK
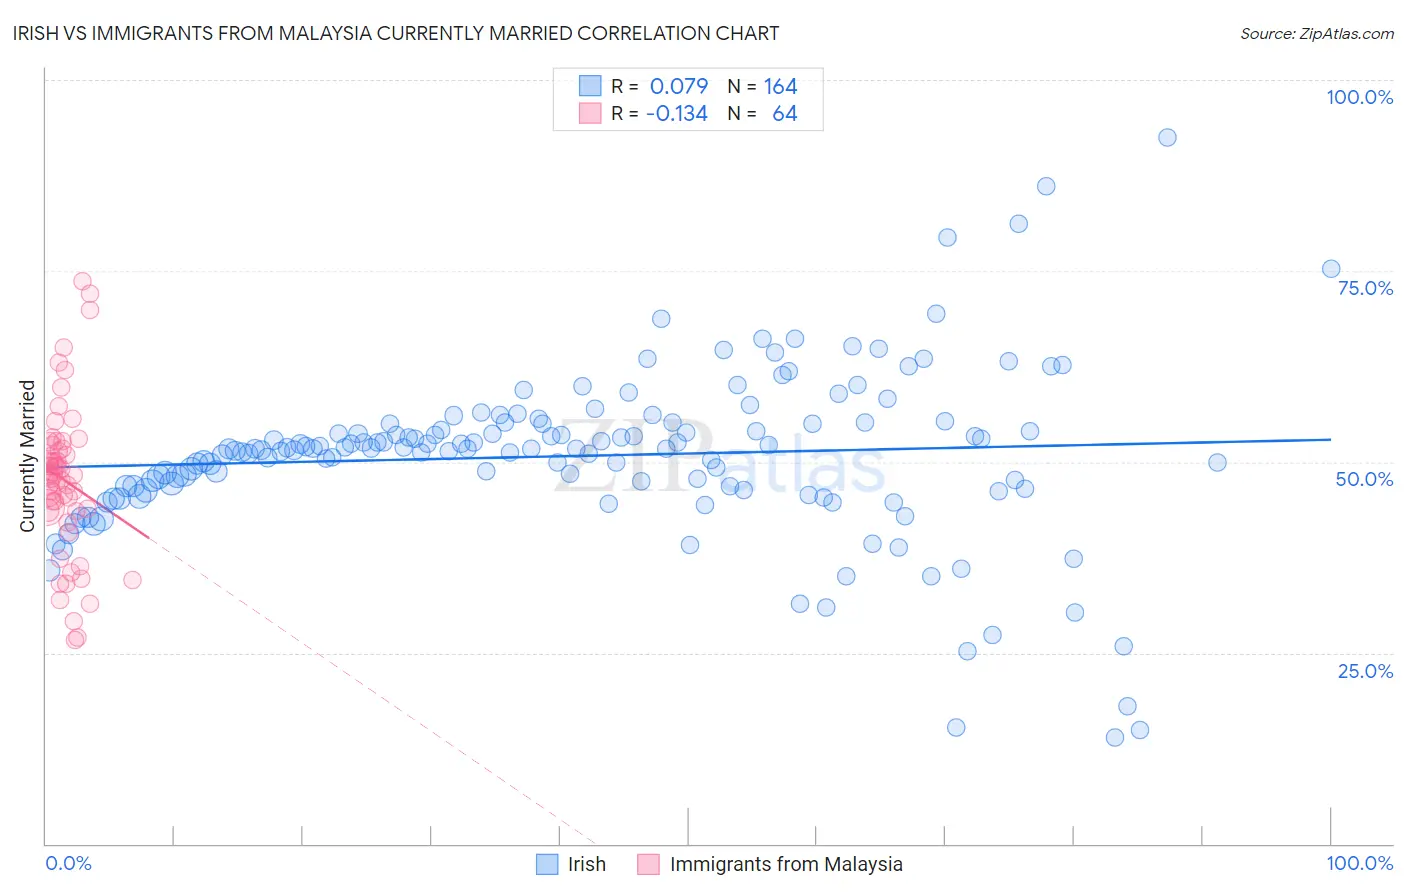
Irish vs Immigrants from Malaysia Currently Married Correlation Chart
The statistical analysis conducted on geographies consisting of 580,554,006 people shows a slight positive correlation between the proportion of Irish and percentage of population currently married in the United States with a correlation coefficient (R) of 0.079 and weighted average of 48.9%. Similarly, the statistical analysis conducted on geographies consisting of 197,973,854 people shows a poor negative correlation between the proportion of Immigrants from Malaysia and percentage of population currently married in the United States with a correlation coefficient (R) of -0.134 and weighted average of 47.3%, a difference of 3.4%.
Currently Married Correlation Summary
| Measurement | Irish | Immigrants from Malaysia |
| Minimum | 13.9% | 26.6% |
| Maximum | 92.5% | 73.6% |
| Range | 78.6% | 47.0% |
| Mean | 50.8% | 47.7% |
| Median | 51.7% | 48.3% |
| Interquartile 25% (IQ1) | 46.6% | 43.8% |
| Interquartile 75% (IQ3) | 55.0% | 51.9% |
| Interquartile Range (IQR) | 8.4% | 8.2% |
| Standard Deviation (Sample) | 11.2% | 9.8% |
| Standard Deviation (Population) | 11.1% | 9.8% |
Similar Demographics by Currently Married
Demographics Similar to Irish by Currently Married
In terms of currently married, the demographic groups most similar to Irish are Immigrants from Hong Kong (48.9%, a difference of 0.040%), Eastern European (48.9%, a difference of 0.050%), Polish (48.9%, a difference of 0.050%), Croatian (48.9%, a difference of 0.060%), and Immigrants from Lithuania (48.8%, a difference of 0.060%).
| Demographics | Rating | Rank | Currently Married |
| Immigrants | Korea | 99.6 /100 | #26 | Exceptional 49.0% |
| Burmese | 99.6 /100 | #27 | Exceptional 48.9% |
| Welsh | 99.5 /100 | #28 | Exceptional 48.9% |
| Croatians | 99.5 /100 | #29 | Exceptional 48.9% |
| Eastern Europeans | 99.5 /100 | #30 | Exceptional 48.9% |
| Poles | 99.5 /100 | #31 | Exceptional 48.9% |
| Immigrants | Hong Kong | 99.5 /100 | #32 | Exceptional 48.9% |
| Irish | 99.5 /100 | #33 | Exceptional 48.9% |
| Immigrants | Lithuania | 99.4 /100 | #34 | Exceptional 48.8% |
| Immigrants | Northern Europe | 99.4 /100 | #35 | Exceptional 48.8% |
| Italians | 99.4 /100 | #36 | Exceptional 48.8% |
| Hungarians | 99.4 /100 | #37 | Exceptional 48.8% |
| Czechoslovakians | 99.4 /100 | #38 | Exceptional 48.8% |
| British | 99.4 /100 | #39 | Exceptional 48.8% |
| Immigrants | Canada | 99.4 /100 | #40 | Exceptional 48.8% |
Demographics Similar to Immigrants from Malaysia by Currently Married
In terms of currently married, the demographic groups most similar to Immigrants from Malaysia are Immigrants from Australia (47.3%, a difference of 0.0%), Afghan (47.3%, a difference of 0.040%), Icelander (47.3%, a difference of 0.080%), Immigrants from Norway (47.2%, a difference of 0.080%), and Immigrants from Iraq (47.3%, a difference of 0.10%).
| Demographics | Rating | Rank | Currently Married |
| Immigrants | Jordan | 84.9 /100 | #126 | Excellent 47.4% |
| New Zealanders | 84.9 /100 | #127 | Excellent 47.4% |
| Portuguese | 84.2 /100 | #128 | Excellent 47.3% |
| Sri Lankans | 83.2 /100 | #129 | Excellent 47.3% |
| Immigrants | Iraq | 82.8 /100 | #130 | Excellent 47.3% |
| Icelanders | 82.4 /100 | #131 | Excellent 47.3% |
| Afghans | 81.8 /100 | #132 | Excellent 47.3% |
| Immigrants | Malaysia | 81.1 /100 | #133 | Excellent 47.3% |
| Immigrants | Australia | 81.1 /100 | #134 | Excellent 47.3% |
| Immigrants | Norway | 79.7 /100 | #135 | Good 47.2% |
| Immigrants | Vietnam | 78.2 /100 | #136 | Good 47.2% |
| Paraguayans | 77.8 /100 | #137 | Good 47.2% |
| Pakistanis | 77.5 /100 | #138 | Good 47.2% |
| Yugoslavians | 77.4 /100 | #139 | Good 47.2% |
| Cajuns | 75.3 /100 | #140 | Good 47.1% |