Irish vs Immigrants from Haiti Currently Married
COMPARE
Irish
Immigrants from Haiti
Currently Married
Currently Married Comparison
Irish
Immigrants from Haiti
48.9%
CURRENTLY MARRIED
99.5/ 100
METRIC RATING
33rd/ 347
METRIC RANK
41.0%
CURRENTLY MARRIED
0.0/ 100
METRIC RATING
322nd/ 347
METRIC RANK
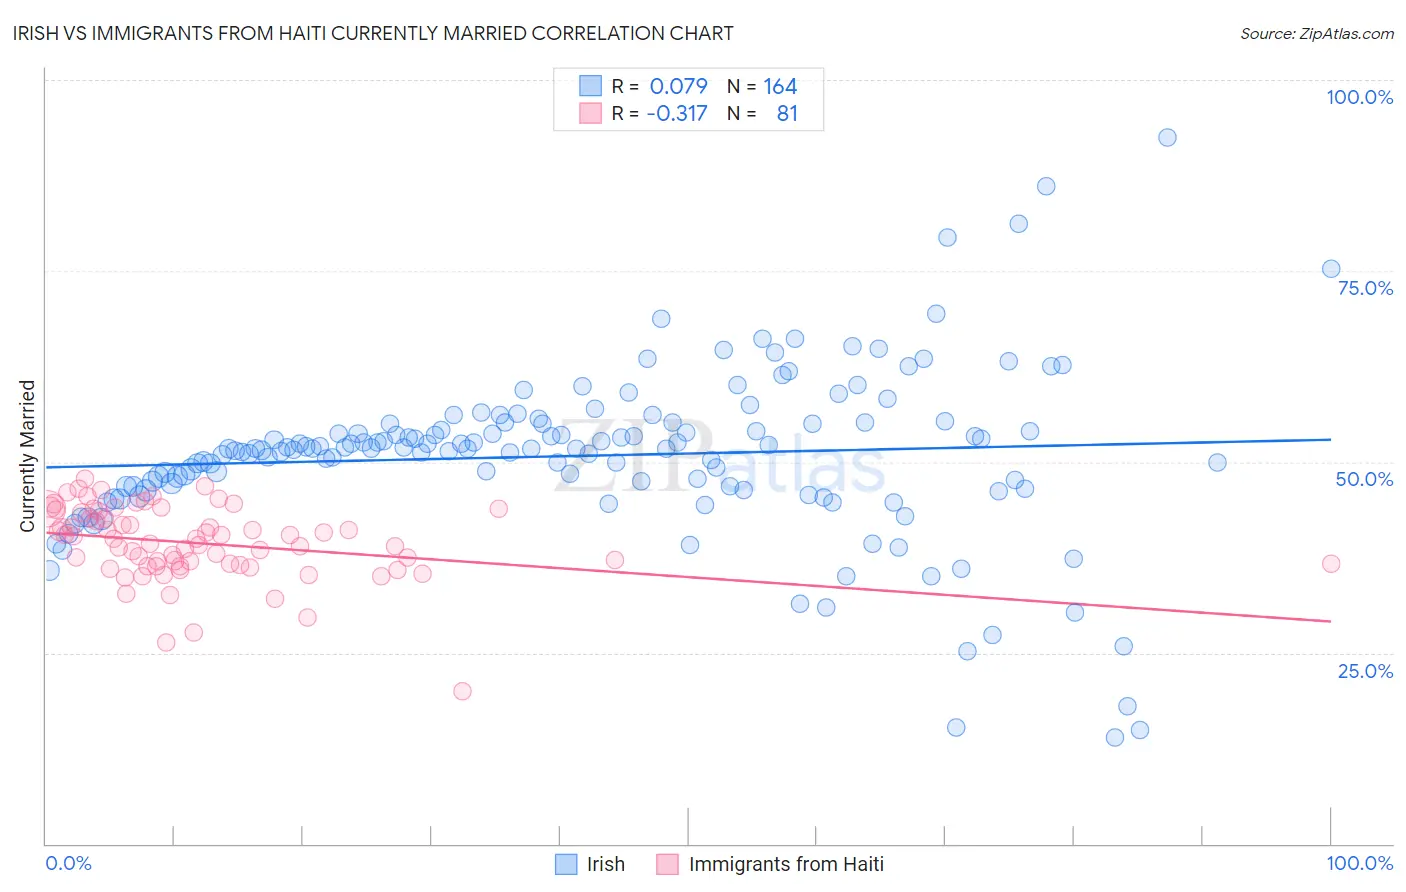
Irish vs Immigrants from Haiti Currently Married Correlation Chart
The statistical analysis conducted on geographies consisting of 580,554,006 people shows a slight positive correlation between the proportion of Irish and percentage of population currently married in the United States with a correlation coefficient (R) of 0.079 and weighted average of 48.9%. Similarly, the statistical analysis conducted on geographies consisting of 225,264,174 people shows a mild negative correlation between the proportion of Immigrants from Haiti and percentage of population currently married in the United States with a correlation coefficient (R) of -0.317 and weighted average of 41.0%, a difference of 19.2%.
Currently Married Correlation Summary
| Measurement | Irish | Immigrants from Haiti |
| Minimum | 13.9% | 19.9% |
| Maximum | 92.5% | 47.8% |
| Range | 78.6% | 27.9% |
| Mean | 50.8% | 39.3% |
| Median | 51.7% | 39.9% |
| Interquartile 25% (IQ1) | 46.6% | 36.4% |
| Interquartile 75% (IQ3) | 55.0% | 43.5% |
| Interquartile Range (IQR) | 8.4% | 7.1% |
| Standard Deviation (Sample) | 11.2% | 4.9% |
| Standard Deviation (Population) | 11.1% | 4.9% |
Similar Demographics by Currently Married
Demographics Similar to Irish by Currently Married
In terms of currently married, the demographic groups most similar to Irish are Immigrants from Hong Kong (48.9%, a difference of 0.040%), Eastern European (48.9%, a difference of 0.050%), Polish (48.9%, a difference of 0.050%), Croatian (48.9%, a difference of 0.060%), and Immigrants from Lithuania (48.8%, a difference of 0.060%).
| Demographics | Rating | Rank | Currently Married |
| Immigrants | Korea | 99.6 /100 | #26 | Exceptional 49.0% |
| Burmese | 99.6 /100 | #27 | Exceptional 48.9% |
| Welsh | 99.5 /100 | #28 | Exceptional 48.9% |
| Croatians | 99.5 /100 | #29 | Exceptional 48.9% |
| Eastern Europeans | 99.5 /100 | #30 | Exceptional 48.9% |
| Poles | 99.5 /100 | #31 | Exceptional 48.9% |
| Immigrants | Hong Kong | 99.5 /100 | #32 | Exceptional 48.9% |
| Irish | 99.5 /100 | #33 | Exceptional 48.9% |
| Immigrants | Lithuania | 99.4 /100 | #34 | Exceptional 48.8% |
| Immigrants | Northern Europe | 99.4 /100 | #35 | Exceptional 48.8% |
| Italians | 99.4 /100 | #36 | Exceptional 48.8% |
| Hungarians | 99.4 /100 | #37 | Exceptional 48.8% |
| Czechoslovakians | 99.4 /100 | #38 | Exceptional 48.8% |
| British | 99.4 /100 | #39 | Exceptional 48.8% |
| Immigrants | Canada | 99.4 /100 | #40 | Exceptional 48.8% |
Demographics Similar to Immigrants from Haiti by Currently Married
In terms of currently married, the demographic groups most similar to Immigrants from Haiti are Immigrants from Congo (41.1%, a difference of 0.13%), Immigrants from Jamaica (41.1%, a difference of 0.36%), Immigrants from Somalia (41.2%, a difference of 0.43%), Bahamian (41.2%, a difference of 0.44%), and Haitian (41.3%, a difference of 0.63%).
| Demographics | Rating | Rank | Currently Married |
| Inupiat | 0.0 /100 | #315 | Tragic 41.3% |
| Immigrants | Caribbean | 0.0 /100 | #316 | Tragic 41.3% |
| Haitians | 0.0 /100 | #317 | Tragic 41.3% |
| Bahamians | 0.0 /100 | #318 | Tragic 41.2% |
| Immigrants | Somalia | 0.0 /100 | #319 | Tragic 41.2% |
| Immigrants | Jamaica | 0.0 /100 | #320 | Tragic 41.1% |
| Immigrants | Congo | 0.0 /100 | #321 | Tragic 41.1% |
| Immigrants | Haiti | 0.0 /100 | #322 | Tragic 41.0% |
| Immigrants | West Indies | 0.0 /100 | #323 | Tragic 40.7% |
| Immigrants | Senegal | 0.0 /100 | #324 | Tragic 40.7% |
| U.S. Virgin Islanders | 0.0 /100 | #325 | Tragic 40.7% |
| Barbadians | 0.0 /100 | #326 | Tragic 40.6% |
| Senegalese | 0.0 /100 | #327 | Tragic 40.6% |
| Arapaho | 0.0 /100 | #328 | Tragic 40.5% |
| Crow | 0.0 /100 | #329 | Tragic 40.4% |