Dutch vs Immigrants from Haiti Currently Married
COMPARE
Dutch
Immigrants from Haiti
Currently Married
Currently Married Comparison
Dutch
Immigrants from Haiti
49.6%
CURRENTLY MARRIED
99.9/ 100
METRIC RATING
13th/ 347
METRIC RANK
41.0%
CURRENTLY MARRIED
0.0/ 100
METRIC RATING
322nd/ 347
METRIC RANK
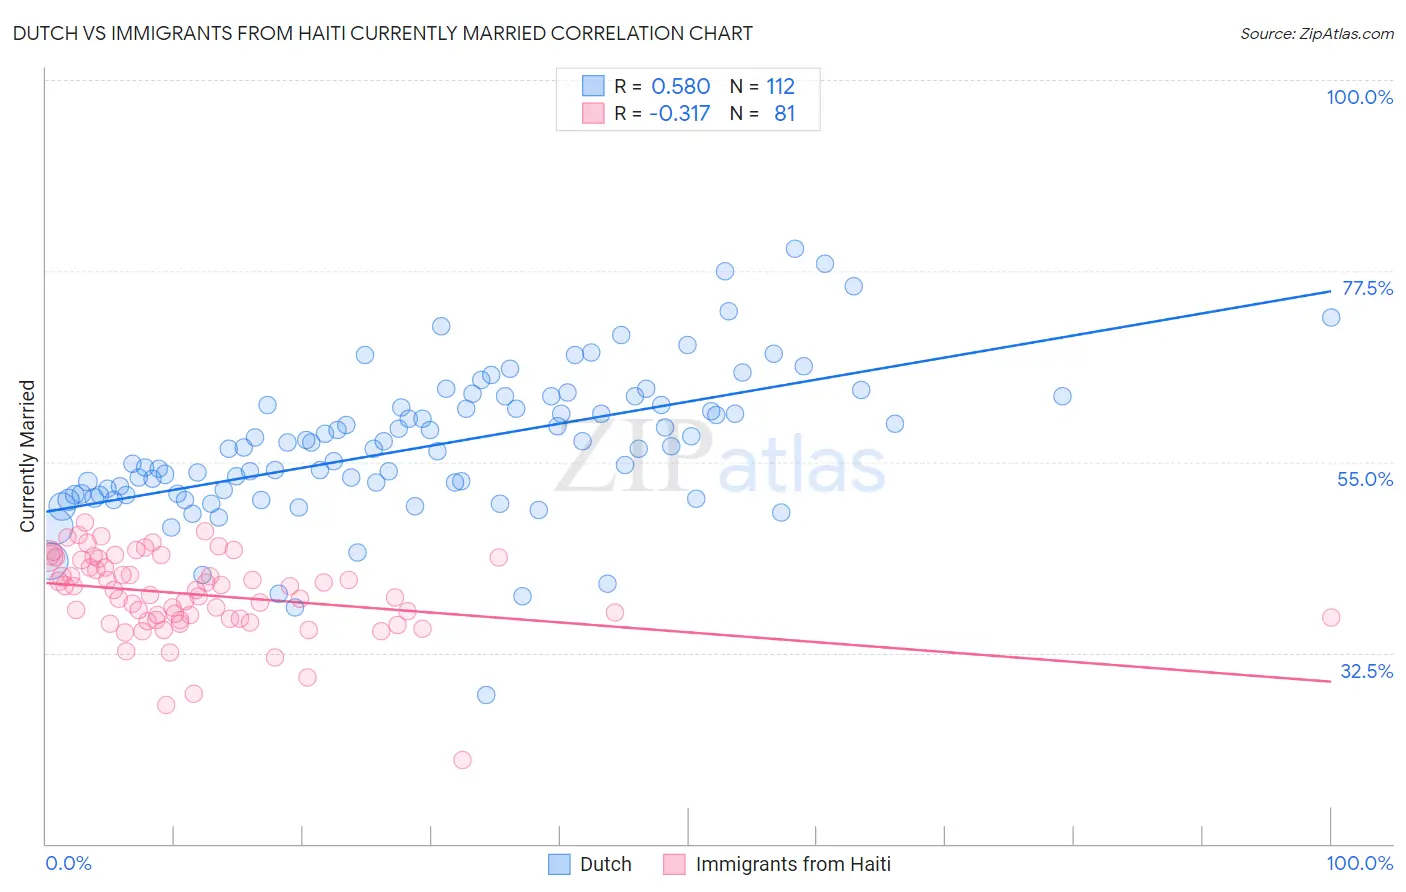
Dutch vs Immigrants from Haiti Currently Married Correlation Chart
The statistical analysis conducted on geographies consisting of 554,255,721 people shows a substantial positive correlation between the proportion of Dutch and percentage of population currently married in the United States with a correlation coefficient (R) of 0.580 and weighted average of 49.6%. Similarly, the statistical analysis conducted on geographies consisting of 225,264,174 people shows a mild negative correlation between the proportion of Immigrants from Haiti and percentage of population currently married in the United States with a correlation coefficient (R) of -0.317 and weighted average of 41.0%, a difference of 21.0%.
Currently Married Correlation Summary
| Measurement | Dutch | Immigrants from Haiti |
| Minimum | 27.6% | 19.9% |
| Maximum | 80.1% | 47.8% |
| Range | 52.5% | 27.9% |
| Mean | 56.8% | 39.3% |
| Median | 56.6% | 39.9% |
| Interquartile 25% (IQ1) | 51.2% | 36.4% |
| Interquartile 75% (IQ3) | 61.7% | 43.5% |
| Interquartile Range (IQR) | 10.6% | 7.1% |
| Standard Deviation (Sample) | 8.6% | 4.9% |
| Standard Deviation (Population) | 8.6% | 4.9% |
Similar Demographics by Currently Married
Demographics Similar to Dutch by Currently Married
In terms of currently married, the demographic groups most similar to Dutch are German (49.6%, a difference of 0.010%), Pennsylvania German (49.6%, a difference of 0.040%), Chinese (49.5%, a difference of 0.18%), Scandinavian (49.5%, a difference of 0.20%), and English (49.7%, a difference of 0.26%).
| Demographics | Rating | Rank | Currently Married |
| Norwegians | 100.0 /100 | #6 | Exceptional 50.2% |
| Immigrants | South Central Asia | 100.0 /100 | #7 | Exceptional 50.0% |
| Swedes | 100.0 /100 | #8 | Exceptional 50.0% |
| Czechs | 99.9 /100 | #9 | Exceptional 49.9% |
| Filipinos | 99.9 /100 | #10 | Exceptional 49.7% |
| English | 99.9 /100 | #11 | Exceptional 49.7% |
| Swiss | 99.9 /100 | #12 | Exceptional 49.7% |
| Dutch | 99.9 /100 | #13 | Exceptional 49.6% |
| Germans | 99.9 /100 | #14 | Exceptional 49.6% |
| Pennsylvania Germans | 99.9 /100 | #15 | Exceptional 49.6% |
| Chinese | 99.9 /100 | #16 | Exceptional 49.5% |
| Scandinavians | 99.9 /100 | #17 | Exceptional 49.5% |
| Immigrants | Scotland | 99.8 /100 | #18 | Exceptional 49.3% |
| Europeans | 99.8 /100 | #19 | Exceptional 49.3% |
| Luxembourgers | 99.8 /100 | #20 | Exceptional 49.3% |
Demographics Similar to Immigrants from Haiti by Currently Married
In terms of currently married, the demographic groups most similar to Immigrants from Haiti are Immigrants from Congo (41.1%, a difference of 0.13%), Immigrants from Jamaica (41.1%, a difference of 0.36%), Immigrants from Somalia (41.2%, a difference of 0.43%), Bahamian (41.2%, a difference of 0.44%), and Haitian (41.3%, a difference of 0.63%).
| Demographics | Rating | Rank | Currently Married |
| Inupiat | 0.0 /100 | #315 | Tragic 41.3% |
| Immigrants | Caribbean | 0.0 /100 | #316 | Tragic 41.3% |
| Haitians | 0.0 /100 | #317 | Tragic 41.3% |
| Bahamians | 0.0 /100 | #318 | Tragic 41.2% |
| Immigrants | Somalia | 0.0 /100 | #319 | Tragic 41.2% |
| Immigrants | Jamaica | 0.0 /100 | #320 | Tragic 41.1% |
| Immigrants | Congo | 0.0 /100 | #321 | Tragic 41.1% |
| Immigrants | Haiti | 0.0 /100 | #322 | Tragic 41.0% |
| Immigrants | West Indies | 0.0 /100 | #323 | Tragic 40.7% |
| Immigrants | Senegal | 0.0 /100 | #324 | Tragic 40.7% |
| U.S. Virgin Islanders | 0.0 /100 | #325 | Tragic 40.7% |
| Barbadians | 0.0 /100 | #326 | Tragic 40.6% |
| Senegalese | 0.0 /100 | #327 | Tragic 40.6% |
| Arapaho | 0.0 /100 | #328 | Tragic 40.5% |
| Crow | 0.0 /100 | #329 | Tragic 40.4% |