Irish vs Immigrants from Haiti 1 or more Vehicles in Household
COMPARE
Irish
Immigrants from Haiti
1 or more Vehicles in Household
1 or more Vehicles in Household Comparison
Irish
Immigrants from Haiti
93.1%
1 OR MORE VEHICLES IN HOUSEHOLD
100.0/ 100
METRIC RATING
14th/ 347
METRIC RANK
84.7%
1 OR MORE VEHICLES IN HOUSEHOLD
0.0/ 100
METRIC RATING
309th/ 347
METRIC RANK
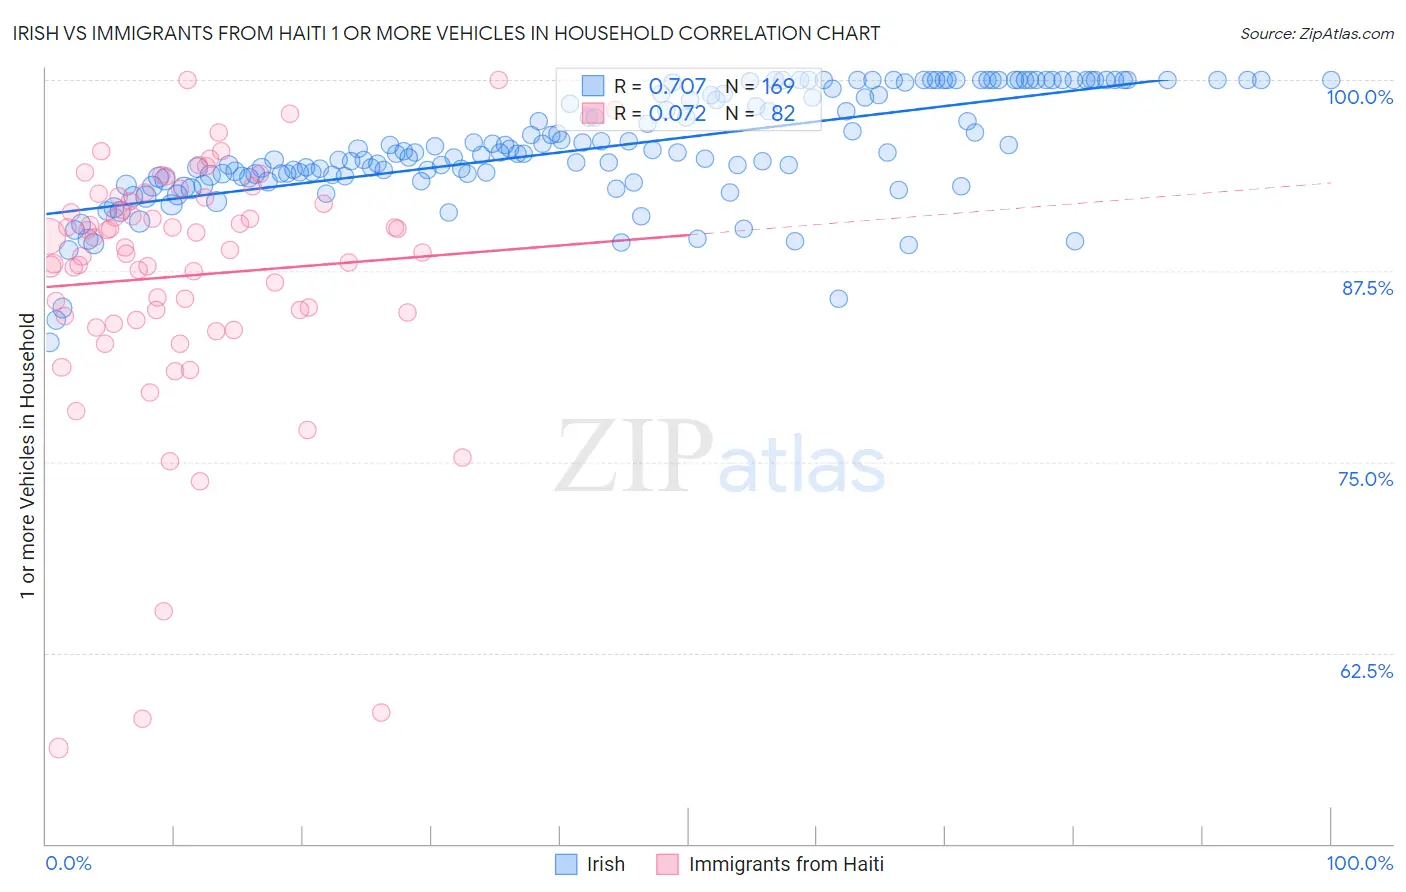
Irish vs Immigrants from Haiti 1 or more Vehicles in Household Correlation Chart
The statistical analysis conducted on geographies consisting of 554,668,080 people shows a strong positive correlation between the proportion of Irish and percentage of households with 1 or more vehicles available in the United States with a correlation coefficient (R) of 0.707 and weighted average of 93.1%. Similarly, the statistical analysis conducted on geographies consisting of 225,185,798 people shows a slight positive correlation between the proportion of Immigrants from Haiti and percentage of households with 1 or more vehicles available in the United States with a correlation coefficient (R) of 0.072 and weighted average of 84.7%, a difference of 9.9%.
1 or more Vehicles in Household Correlation Summary
| Measurement | Irish | Immigrants from Haiti |
| Minimum | 82.8% | 56.3% |
| Maximum | 100.0% | 100.0% |
| Range | 17.2% | 43.7% |
| Mean | 95.6% | 87.2% |
| Median | 95.2% | 88.9% |
| Interquartile 25% (IQ1) | 93.6% | 84.5% |
| Interquartile 75% (IQ3) | 99.6% | 92.1% |
| Interquartile Range (IQR) | 6.0% | 7.5% |
| Standard Deviation (Sample) | 3.6% | 8.3% |
| Standard Deviation (Population) | 3.6% | 8.3% |
Similar Demographics by 1 or more Vehicles in Household
Demographics Similar to Irish by 1 or more Vehicles in Household
In terms of 1 or more vehicles in household, the demographic groups most similar to Irish are Mexican (93.0%, a difference of 0.020%), Assyrian/Chaldean/Syriac (93.0%, a difference of 0.020%), White/Caucasian (93.1%, a difference of 0.040%), European (93.0%, a difference of 0.040%), and Scandinavian (93.1%, a difference of 0.060%).
| Demographics | Rating | Rank | 1 or more Vehicles in Household |
| Scottish | 100.0 /100 | #7 | Exceptional 93.4% |
| Swedes | 100.0 /100 | #8 | Exceptional 93.3% |
| Scotch-Irish | 100.0 /100 | #9 | Exceptional 93.3% |
| Dutch | 100.0 /100 | #10 | Exceptional 93.3% |
| Czechs | 100.0 /100 | #11 | Exceptional 93.3% |
| Scandinavians | 100.0 /100 | #12 | Exceptional 93.1% |
| Whites/Caucasians | 100.0 /100 | #13 | Exceptional 93.1% |
| Irish | 100.0 /100 | #14 | Exceptional 93.1% |
| Mexicans | 100.0 /100 | #15 | Exceptional 93.0% |
| Assyrians/Chaldeans/Syriacs | 100.0 /100 | #16 | Exceptional 93.0% |
| Europeans | 100.0 /100 | #17 | Exceptional 93.0% |
| Welsh | 100.0 /100 | #18 | Exceptional 93.0% |
| Tongans | 100.0 /100 | #19 | Exceptional 92.9% |
| Arapaho | 100.0 /100 | #20 | Exceptional 92.7% |
| Ottawa | 100.0 /100 | #21 | Exceptional 92.7% |
Demographics Similar to Immigrants from Haiti by 1 or more Vehicles in Household
In terms of 1 or more vehicles in household, the demographic groups most similar to Immigrants from Haiti are Immigrants from Belize (84.7%, a difference of 0.010%), U.S. Virgin Islander (84.6%, a difference of 0.030%), Tohono O'odham (84.7%, a difference of 0.040%), Puerto Rican (84.6%, a difference of 0.070%), and Cape Verdean (84.5%, a difference of 0.18%).
| Demographics | Rating | Rank | 1 or more Vehicles in Household |
| Moroccans | 0.0 /100 | #302 | Tragic 85.4% |
| Immigrants | Greece | 0.0 /100 | #303 | Tragic 85.4% |
| Immigrants | Ukraine | 0.0 /100 | #304 | Tragic 85.2% |
| Immigrants | China | 0.0 /100 | #305 | Tragic 84.9% |
| Immigrants | Western Africa | 0.0 /100 | #306 | Tragic 84.9% |
| Tohono O'odham | 0.0 /100 | #307 | Tragic 84.7% |
| Immigrants | Belize | 0.0 /100 | #308 | Tragic 84.7% |
| Immigrants | Haiti | 0.0 /100 | #309 | Tragic 84.7% |
| U.S. Virgin Islanders | 0.0 /100 | #310 | Tragic 84.6% |
| Puerto Ricans | 0.0 /100 | #311 | Tragic 84.6% |
| Cape Verdeans | 0.0 /100 | #312 | Tragic 84.5% |
| Immigrants | Israel | 0.0 /100 | #313 | Tragic 84.5% |
| Albanians | 0.0 /100 | #314 | Tragic 84.4% |
| Cypriots | 0.0 /100 | #315 | Tragic 84.4% |
| Alaska Natives | 0.0 /100 | #316 | Tragic 83.8% |