Irish vs Immigrants from Haiti 11th Grade
COMPARE
Irish
Immigrants from Haiti
11th Grade
11th Grade Comparison
Irish
Immigrants from Haiti
94.4%
11TH GRADE
100.0/ 100
METRIC RATING
25th/ 347
METRIC RANK
89.9%
11TH GRADE
0.0/ 100
METRIC RATING
300th/ 347
METRIC RANK
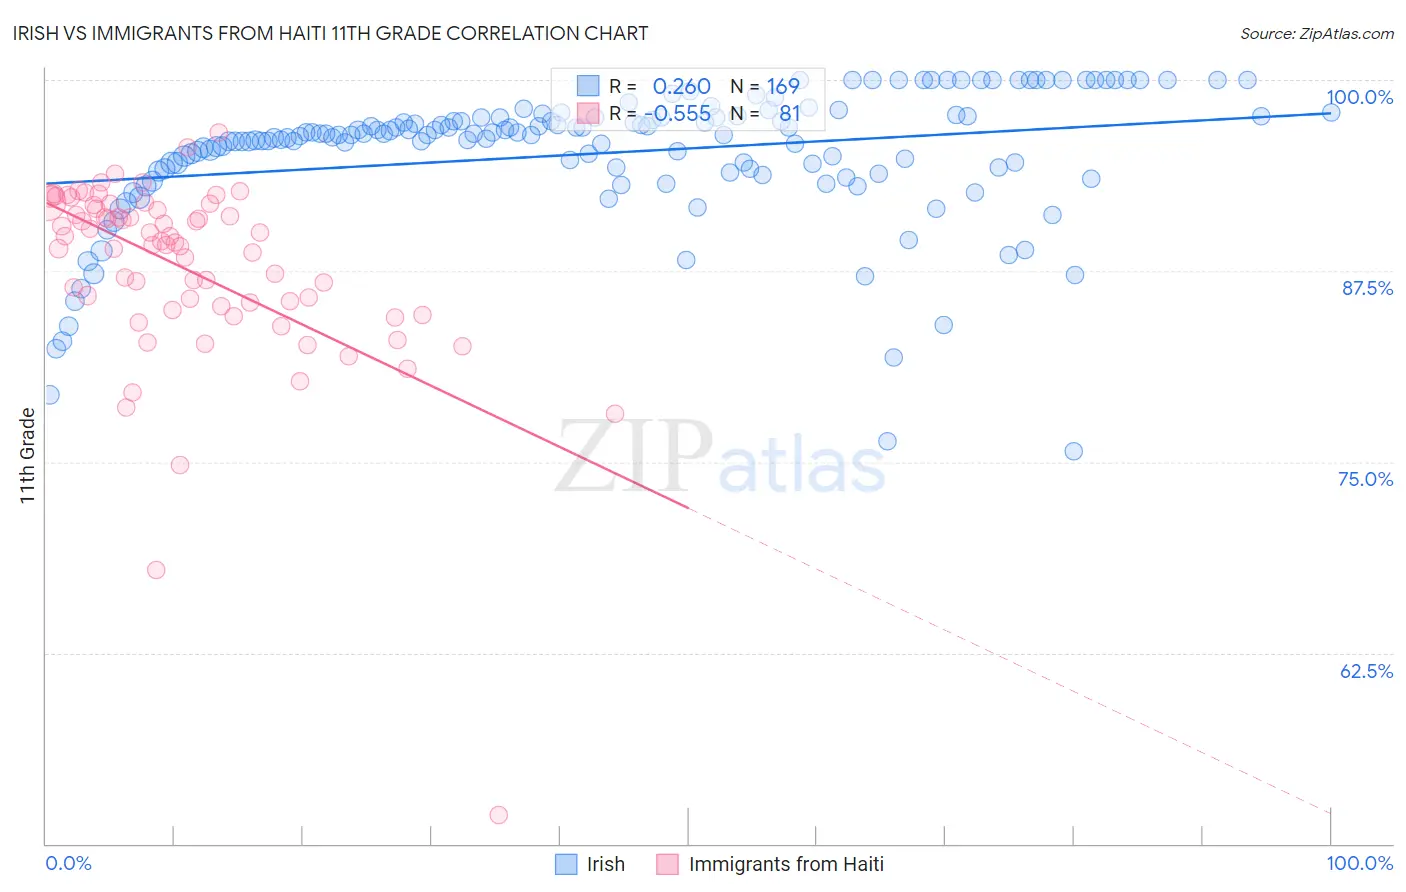
Irish vs Immigrants from Haiti 11th Grade Correlation Chart
The statistical analysis conducted on geographies consisting of 580,710,164 people shows a weak positive correlation between the proportion of Irish and percentage of population with at least 11th grade education in the United States with a correlation coefficient (R) of 0.260 and weighted average of 94.4%. Similarly, the statistical analysis conducted on geographies consisting of 225,286,322 people shows a substantial negative correlation between the proportion of Immigrants from Haiti and percentage of population with at least 11th grade education in the United States with a correlation coefficient (R) of -0.555 and weighted average of 89.9%, a difference of 5.0%.
11th Grade Correlation Summary
| Measurement | Irish | Immigrants from Haiti |
| Minimum | 75.7% | 51.9% |
| Maximum | 100.0% | 96.6% |
| Range | 24.3% | 44.7% |
| Mean | 95.2% | 87.6% |
| Median | 96.4% | 89.3% |
| Interquartile 25% (IQ1) | 94.1% | 85.1% |
| Interquartile 75% (IQ3) | 97.6% | 91.7% |
| Interquartile Range (IQR) | 3.4% | 6.6% |
| Standard Deviation (Sample) | 4.5% | 6.3% |
| Standard Deviation (Population) | 4.5% | 6.3% |
Similar Demographics by 11th Grade
Demographics Similar to Irish by 11th Grade
In terms of 11th grade, the demographic groups most similar to Irish are Scottish (94.4%, a difference of 0.0%), English (94.4%, a difference of 0.020%), European (94.4%, a difference of 0.020%), Estonian (94.4%, a difference of 0.030%), and Tsimshian (94.4%, a difference of 0.050%).
| Demographics | Rating | Rank | 11th Grade |
| Maltese | 100.0 /100 | #18 | Exceptional 94.5% |
| Scandinavians | 100.0 /100 | #19 | Exceptional 94.5% |
| Italians | 100.0 /100 | #20 | Exceptional 94.5% |
| Tlingit-Haida | 100.0 /100 | #21 | Exceptional 94.4% |
| Tsimshian | 100.0 /100 | #22 | Exceptional 94.4% |
| Czechs | 100.0 /100 | #23 | Exceptional 94.4% |
| English | 100.0 /100 | #24 | Exceptional 94.4% |
| Irish | 100.0 /100 | #25 | Exceptional 94.4% |
| Scottish | 100.0 /100 | #26 | Exceptional 94.4% |
| Europeans | 100.0 /100 | #27 | Exceptional 94.4% |
| Estonians | 100.0 /100 | #28 | Exceptional 94.4% |
| Dutch | 100.0 /100 | #29 | Exceptional 94.3% |
| Russians | 100.0 /100 | #30 | Exceptional 94.3% |
| Welsh | 99.9 /100 | #31 | Exceptional 94.2% |
| Belgians | 99.9 /100 | #32 | Exceptional 94.2% |
Demographics Similar to Immigrants from Haiti by 11th Grade
In terms of 11th grade, the demographic groups most similar to Immigrants from Haiti are Japanese (89.9%, a difference of 0.010%), Guyanese (89.9%, a difference of 0.010%), Immigrants from Fiji (89.9%, a difference of 0.040%), Navajo (90.0%, a difference of 0.11%), and Fijian (90.0%, a difference of 0.15%).
| Demographics | Rating | Rank | 11th Grade |
| Natives/Alaskans | 0.0 /100 | #293 | Tragic 90.2% |
| Immigrants | Grenada | 0.0 /100 | #294 | Tragic 90.1% |
| Immigrants | Vietnam | 0.0 /100 | #295 | Tragic 90.0% |
| Fijians | 0.0 /100 | #296 | Tragic 90.0% |
| Navajo | 0.0 /100 | #297 | Tragic 90.0% |
| Immigrants | Fiji | 0.0 /100 | #298 | Tragic 89.9% |
| Japanese | 0.0 /100 | #299 | Tragic 89.9% |
| Immigrants | Haiti | 0.0 /100 | #300 | Tragic 89.9% |
| Guyanese | 0.0 /100 | #301 | Tragic 89.9% |
| Immigrants | Guyana | 0.0 /100 | #302 | Tragic 89.7% |
| Immigrants | Immigrants | 0.0 /100 | #303 | Tragic 89.7% |
| Yuman | 0.0 /100 | #304 | Tragic 89.7% |
| Immigrants | Cambodia | 0.0 /100 | #305 | Tragic 89.6% |
| Ecuadorians | 0.0 /100 | #306 | Tragic 89.6% |
| Immigrants | Dominica | 0.0 /100 | #307 | Tragic 89.5% |