Irish vs Immigrants from Asia Divorced or Separated
COMPARE
Irish
Immigrants from Asia
Divorced or Separated
Divorced or Separated Comparison
Irish
Immigrants from Asia
12.5%
DIVORCED OR SEPARATED
1.3/ 100
METRIC RATING
250th/ 347
METRIC RANK
10.7%
DIVORCED OR SEPARATED
100.0/ 100
METRIC RATING
21st/ 347
METRIC RANK
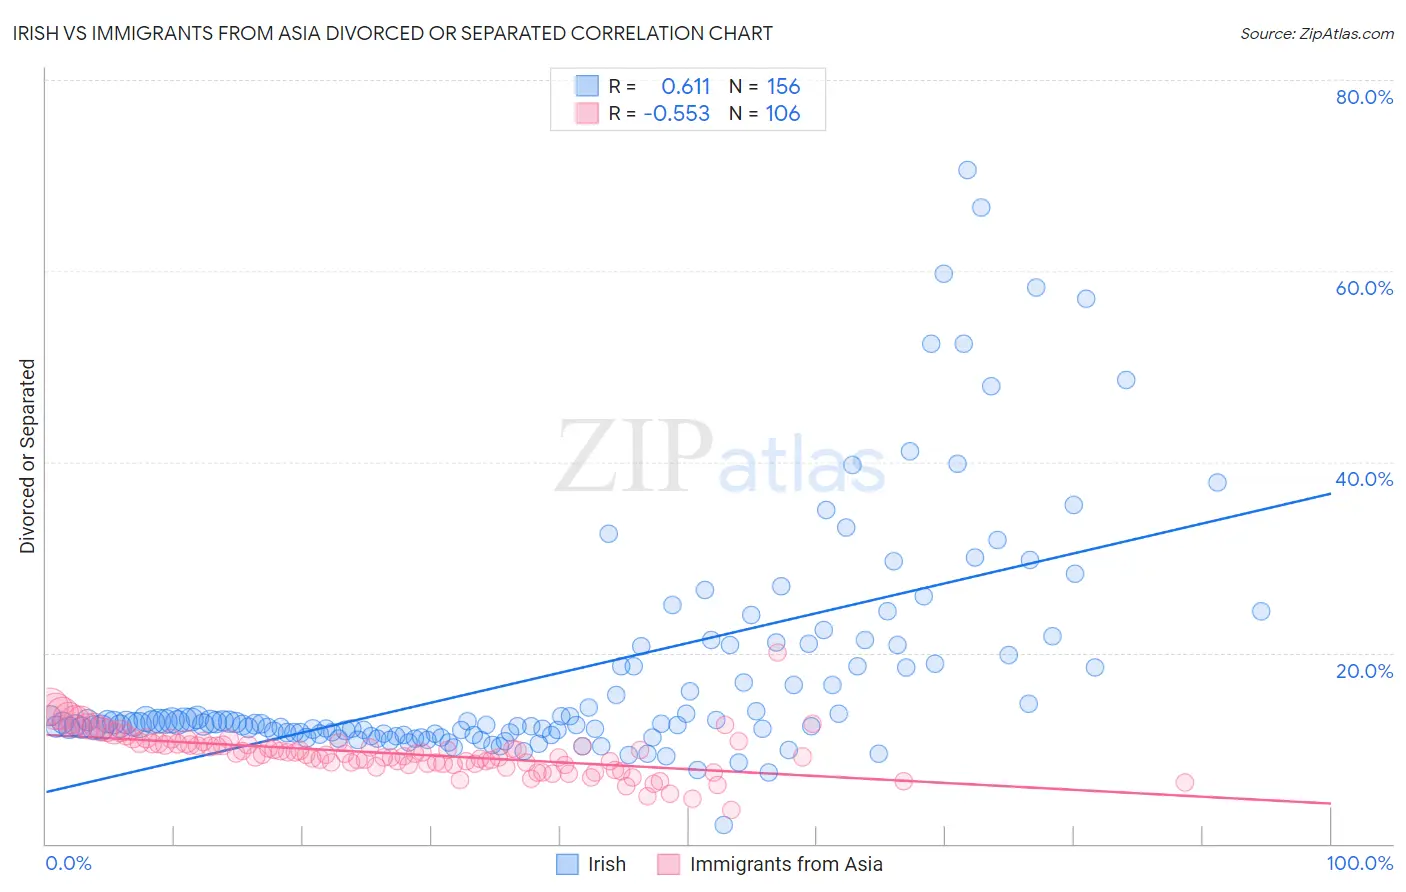
Irish vs Immigrants from Asia Divorced or Separated Correlation Chart
The statistical analysis conducted on geographies consisting of 580,050,649 people shows a significant positive correlation between the proportion of Irish and percentage of population currently divorced or separated in the United States with a correlation coefficient (R) of 0.611 and weighted average of 12.5%. Similarly, the statistical analysis conducted on geographies consisting of 548,726,579 people shows a substantial negative correlation between the proportion of Immigrants from Asia and percentage of population currently divorced or separated in the United States with a correlation coefficient (R) of -0.553 and weighted average of 10.7%, a difference of 16.6%.
Divorced or Separated Correlation Summary
| Measurement | Irish | Immigrants from Asia |
| Minimum | 2.0% | 3.6% |
| Maximum | 70.6% | 20.0% |
| Range | 68.7% | 16.4% |
| Mean | 17.8% | 9.4% |
| Median | 12.7% | 9.4% |
| Interquartile 25% (IQ1) | 11.6% | 8.3% |
| Interquartile 75% (IQ3) | 19.3% | 10.5% |
| Interquartile Range (IQR) | 7.7% | 2.2% |
| Standard Deviation (Sample) | 12.1% | 2.3% |
| Standard Deviation (Population) | 12.1% | 2.2% |
Similar Demographics by Divorced or Separated
Demographics Similar to Irish by Divorced or Separated
In terms of divorced or separated, the demographic groups most similar to Irish are Aleut (12.5%, a difference of 0.0%), Finnish (12.5%, a difference of 0.27%), Nepalese (12.5%, a difference of 0.29%), German (12.5%, a difference of 0.31%), and Liberian (12.6%, a difference of 0.33%).
| Demographics | Rating | Rank | Divorced or Separated |
| Immigrants | Latin America | 2.8 /100 | #243 | Tragic 12.4% |
| Alaska Natives | 2.5 /100 | #244 | Tragic 12.4% |
| Hispanics or Latinos | 2.0 /100 | #245 | Tragic 12.5% |
| Immigrants | West Indies | 1.9 /100 | #246 | Tragic 12.5% |
| Germans | 1.8 /100 | #247 | Tragic 12.5% |
| Nepalese | 1.8 /100 | #248 | Tragic 12.5% |
| Finns | 1.8 /100 | #249 | Tragic 12.5% |
| Irish | 1.3 /100 | #250 | Tragic 12.5% |
| Aleuts | 1.3 /100 | #251 | Tragic 12.5% |
| Liberians | 0.9 /100 | #252 | Tragic 12.6% |
| Somalis | 0.9 /100 | #253 | Tragic 12.6% |
| Senegalese | 0.8 /100 | #254 | Tragic 12.6% |
| Welsh | 0.7 /100 | #255 | Tragic 12.6% |
| Immigrants | Colombia | 0.6 /100 | #256 | Tragic 12.6% |
| Immigrants | Somalia | 0.6 /100 | #257 | Tragic 12.6% |
Demographics Similar to Immigrants from Asia by Divorced or Separated
In terms of divorced or separated, the demographic groups most similar to Immigrants from Asia are Burmese (10.7%, a difference of 0.18%), Vietnamese (10.8%, a difference of 0.26%), Immigrants from Pakistan (10.8%, a difference of 0.43%), Immigrants from Sri Lanka (10.8%, a difference of 0.63%), and Iranian (10.8%, a difference of 0.68%).
| Demographics | Rating | Rank | Divorced or Separated |
| Assyrians/Chaldeans/Syriacs | 100.0 /100 | #14 | Exceptional 10.6% |
| Immigrants | Armenia | 100.0 /100 | #15 | Exceptional 10.6% |
| Immigrants | Korea | 100.0 /100 | #16 | Exceptional 10.6% |
| Immigrants | Israel | 100.0 /100 | #17 | Exceptional 10.6% |
| Immigrants | Iran | 100.0 /100 | #18 | Exceptional 10.6% |
| Asians | 100.0 /100 | #19 | Exceptional 10.6% |
| Burmese | 100.0 /100 | #20 | Exceptional 10.7% |
| Immigrants | Asia | 100.0 /100 | #21 | Exceptional 10.7% |
| Vietnamese | 100.0 /100 | #22 | Exceptional 10.8% |
| Immigrants | Pakistan | 100.0 /100 | #23 | Exceptional 10.8% |
| Immigrants | Sri Lanka | 100.0 /100 | #24 | Exceptional 10.8% |
| Iranians | 100.0 /100 | #25 | Exceptional 10.8% |
| Immigrants | Indonesia | 100.0 /100 | #26 | Exceptional 10.9% |
| Immigrants | Bangladesh | 100.0 /100 | #27 | Exceptional 11.0% |
| Immigrants | Malaysia | 100.0 /100 | #28 | Exceptional 11.0% |