Irish vs Immigrants from Asia Single Mother Households
COMPARE
Irish
Immigrants from Asia
Single Mother Households
Single Mother Households Comparison
Irish
Immigrants from Asia
5.8%
SINGLE MOTHER HOUSEHOLDS
94.8/ 100
METRIC RATING
115th/ 347
METRIC RANK
5.6%
SINGLE MOTHER HOUSEHOLDS
98.4/ 100
METRIC RATING
73rd/ 347
METRIC RANK
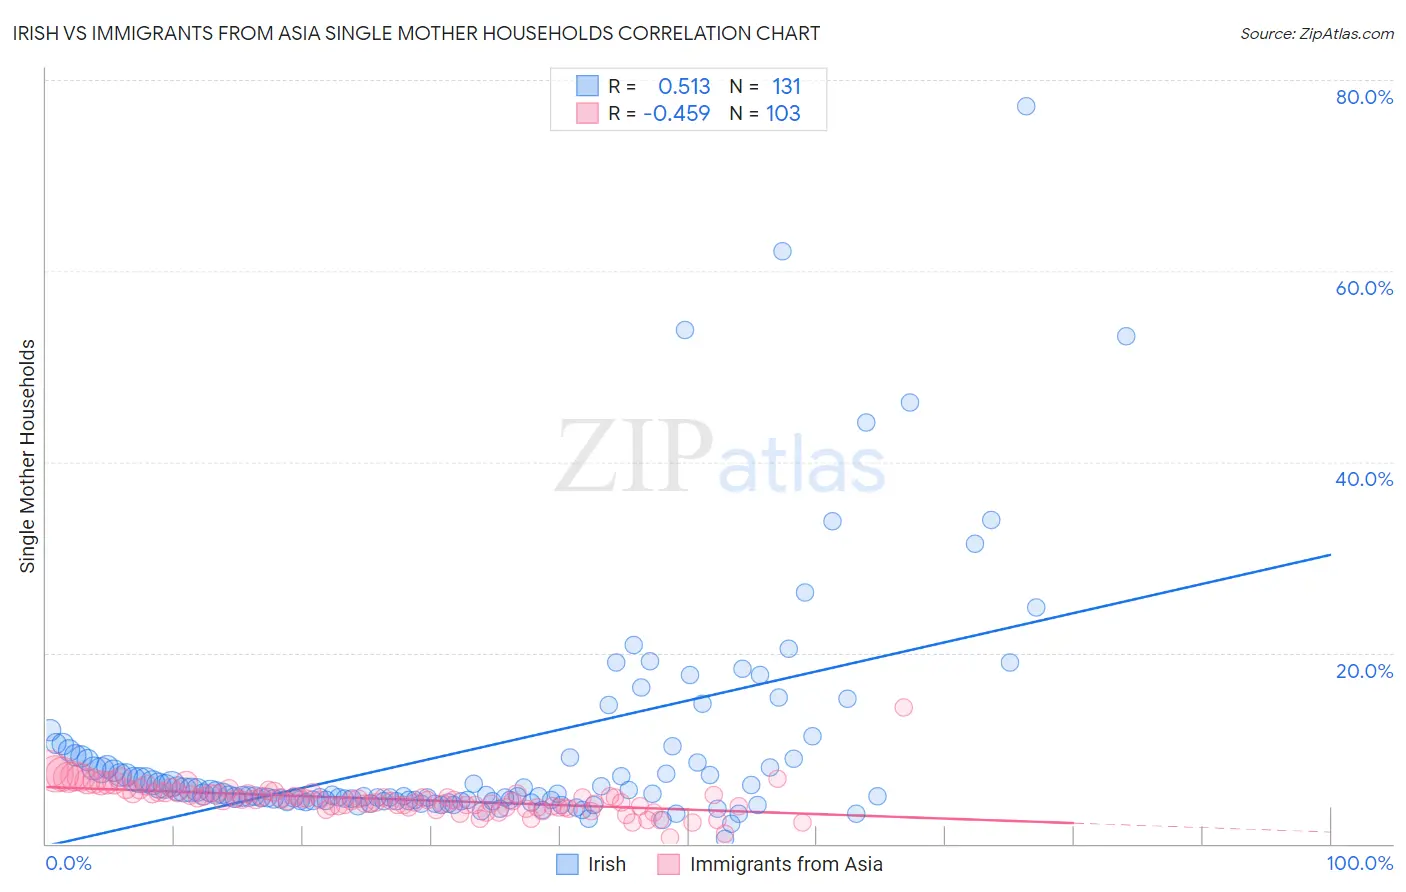
Irish vs Immigrants from Asia Single Mother Households Correlation Chart
The statistical analysis conducted on geographies consisting of 573,559,537 people shows a substantial positive correlation between the proportion of Irish and percentage of single mother households in the United States with a correlation coefficient (R) of 0.513 and weighted average of 5.8%. Similarly, the statistical analysis conducted on geographies consisting of 545,444,216 people shows a moderate negative correlation between the proportion of Immigrants from Asia and percentage of single mother households in the United States with a correlation coefficient (R) of -0.459 and weighted average of 5.6%, a difference of 3.6%.
Single Mother Households Correlation Summary
| Measurement | Irish | Immigrants from Asia |
| Minimum | 0.49% | 0.63% |
| Maximum | 77.3% | 14.2% |
| Range | 76.8% | 13.6% |
| Mean | 10.0% | 4.7% |
| Median | 5.2% | 4.6% |
| Interquartile 25% (IQ1) | 4.5% | 3.8% |
| Interquartile 75% (IQ3) | 9.0% | 5.3% |
| Interquartile Range (IQR) | 4.5% | 1.5% |
| Standard Deviation (Sample) | 12.1% | 1.6% |
| Standard Deviation (Population) | 12.0% | 1.6% |
Similar Demographics by Single Mother Households
Demographics Similar to Irish by Single Mother Households
In terms of single mother households, the demographic groups most similar to Irish are Pennsylvania German (5.8%, a difference of 0.070%), Bolivian (5.8%, a difference of 0.14%), Dutch (5.8%, a difference of 0.19%), Mongolian (5.8%, a difference of 0.31%), and Laotian (5.8%, a difference of 0.32%).
| Demographics | Rating | Rank | Single Mother Households |
| Immigrants | Italy | 95.8 /100 | #108 | Exceptional 5.8% |
| Immigrants | Western Europe | 95.7 /100 | #109 | Exceptional 5.8% |
| British | 95.5 /100 | #110 | Exceptional 5.8% |
| Immigrants | England | 95.5 /100 | #111 | Exceptional 5.8% |
| Immigrants | Kuwait | 95.4 /100 | #112 | Exceptional 5.8% |
| Mongolians | 95.3 /100 | #113 | Exceptional 5.8% |
| Dutch | 95.1 /100 | #114 | Exceptional 5.8% |
| Irish | 94.8 /100 | #115 | Exceptional 5.8% |
| Pennsylvania Germans | 94.7 /100 | #116 | Exceptional 5.8% |
| Bolivians | 94.6 /100 | #117 | Exceptional 5.8% |
| Laotians | 94.3 /100 | #118 | Exceptional 5.8% |
| South Africans | 94.1 /100 | #119 | Exceptional 5.8% |
| Tongans | 93.7 /100 | #120 | Exceptional 5.8% |
| Argentineans | 93.7 /100 | #121 | Exceptional 5.8% |
| Belgians | 93.5 /100 | #122 | Exceptional 5.8% |
Demographics Similar to Immigrants from Asia by Single Mother Households
In terms of single mother households, the demographic groups most similar to Immigrants from Asia are Immigrants from North America (5.6%, a difference of 0.030%), Immigrants from Netherlands (5.6%, a difference of 0.060%), Immigrants from Kazakhstan (5.6%, a difference of 0.15%), Immigrants from Eastern Europe (5.6%, a difference of 0.16%), and Slovene (5.6%, a difference of 0.17%).
| Demographics | Rating | Rank | Single Mother Households |
| Immigrants | Canada | 98.5 /100 | #66 | Exceptional 5.6% |
| Italians | 98.5 /100 | #67 | Exceptional 5.6% |
| Immigrants | Bulgaria | 98.5 /100 | #68 | Exceptional 5.6% |
| Asians | 98.5 /100 | #69 | Exceptional 5.6% |
| Immigrants | Eastern Europe | 98.4 /100 | #70 | Exceptional 5.6% |
| Immigrants | Kazakhstan | 98.4 /100 | #71 | Exceptional 5.6% |
| Immigrants | Netherlands | 98.4 /100 | #72 | Exceptional 5.6% |
| Immigrants | Asia | 98.4 /100 | #73 | Exceptional 5.6% |
| Immigrants | North America | 98.3 /100 | #74 | Exceptional 5.6% |
| Slovenes | 98.3 /100 | #75 | Exceptional 5.6% |
| New Zealanders | 98.2 /100 | #76 | Exceptional 5.6% |
| Romanians | 98.1 /100 | #77 | Exceptional 5.6% |
| Swiss | 98.1 /100 | #78 | Exceptional 5.6% |
| Immigrants | Sri Lanka | 98.0 /100 | #79 | Exceptional 5.6% |
| Czechs | 97.9 /100 | #80 | Exceptional 5.6% |