Iraqi vs Moroccan Cognitive Disability
COMPARE
Iraqi
Moroccan
Cognitive Disability
Cognitive Disability Comparison
Iraqis
Moroccans
17.8%
COGNITIVE DISABILITY
1.4/ 100
METRIC RATING
240th/ 347
METRIC RANK
17.6%
COGNITIVE DISABILITY
5.9/ 100
METRIC RATING
221st/ 347
METRIC RANK
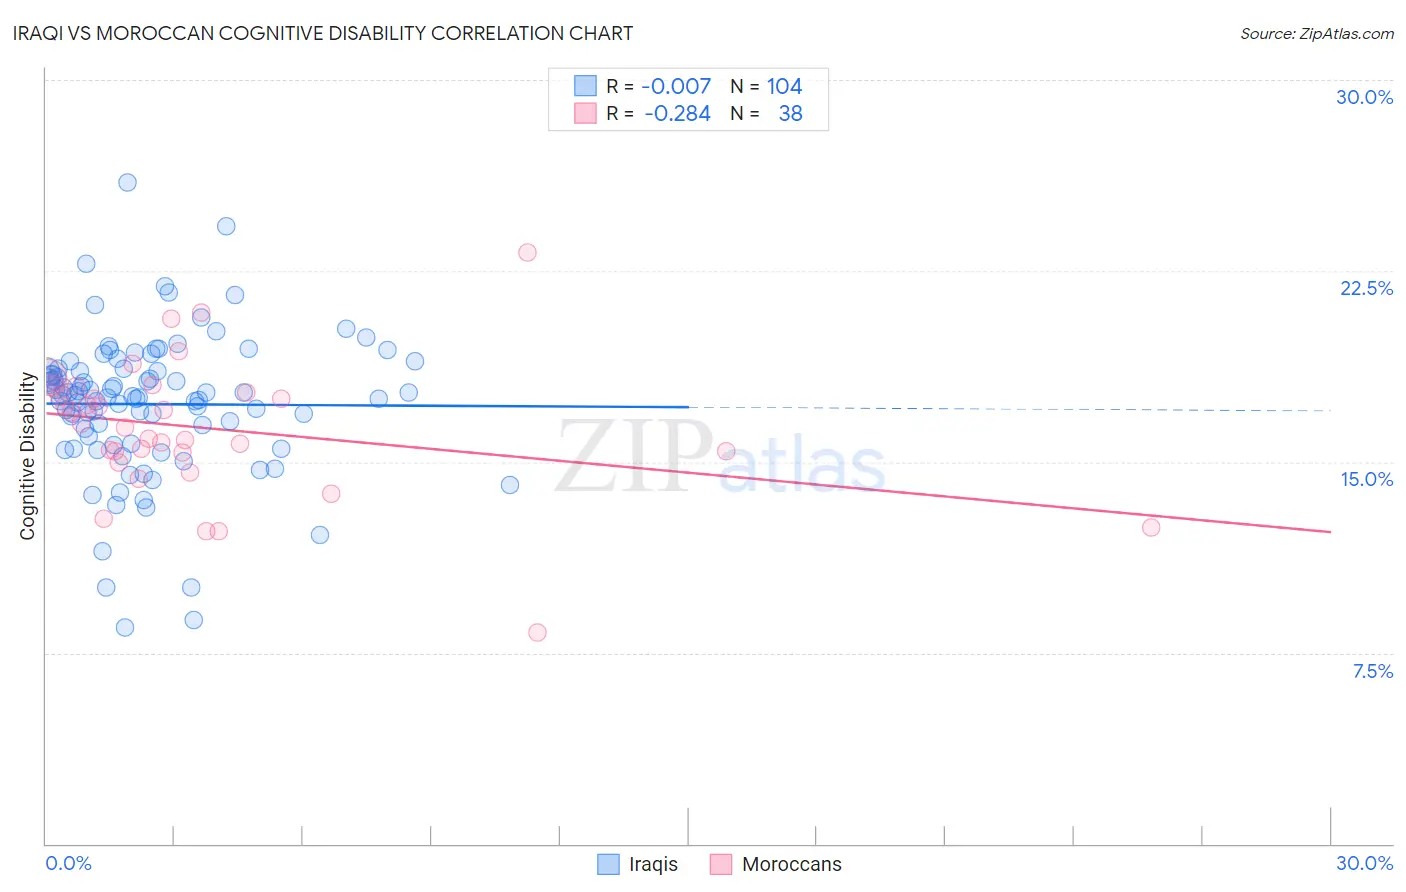
Iraqi vs Moroccan Cognitive Disability Correlation Chart
The statistical analysis conducted on geographies consisting of 170,645,989 people shows no correlation between the proportion of Iraqis and percentage of population with cognitive disability in the United States with a correlation coefficient (R) of -0.007 and weighted average of 17.8%. Similarly, the statistical analysis conducted on geographies consisting of 201,805,523 people shows a weak negative correlation between the proportion of Moroccans and percentage of population with cognitive disability in the United States with a correlation coefficient (R) of -0.284 and weighted average of 17.6%, a difference of 1.1%.
Cognitive Disability Correlation Summary
| Measurement | Iraqi | Moroccan |
| Minimum | 8.5% | 8.3% |
| Maximum | 25.9% | 23.2% |
| Range | 17.5% | 15.0% |
| Mean | 17.3% | 16.3% |
| Median | 17.6% | 16.4% |
| Interquartile 25% (IQ1) | 15.8% | 15.4% |
| Interquartile 75% (IQ3) | 18.6% | 17.7% |
| Interquartile Range (IQR) | 2.8% | 2.3% |
| Standard Deviation (Sample) | 2.8% | 2.7% |
| Standard Deviation (Population) | 2.8% | 2.7% |
Demographics Similar to Iraqis and Moroccans by Cognitive Disability
In terms of cognitive disability, the demographic groups most similar to Iraqis are Cajun (17.8%, a difference of 0.040%), Cheyenne (17.8%, a difference of 0.16%), Immigrants from Mexico (17.8%, a difference of 0.20%), Immigrants from Iraq (17.8%, a difference of 0.21%), and Osage (17.8%, a difference of 0.27%). Similarly, the demographic groups most similar to Moroccans are Zimbabwean (17.6%, a difference of 0.020%), Central American (17.7%, a difference of 0.20%), Alsatian (17.7%, a difference of 0.21%), Fijian (17.7%, a difference of 0.40%), and Vietnamese (17.7%, a difference of 0.41%).
| Demographics | Rating | Rank | Cognitive Disability |
| Zimbabweans | 6.1 /100 | #220 | Tragic 17.6% |
| Moroccans | 5.9 /100 | #221 | Tragic 17.6% |
| Central Americans | 4.5 /100 | #222 | Tragic 17.7% |
| Alsatians | 4.5 /100 | #223 | Tragic 17.7% |
| Fijians | 3.4 /100 | #224 | Tragic 17.7% |
| Vietnamese | 3.4 /100 | #225 | Tragic 17.7% |
| Marshallese | 2.7 /100 | #226 | Tragic 17.7% |
| Immigrants | St. Vincent and the Grenadines | 2.6 /100 | #227 | Tragic 17.7% |
| Immigrants | Central America | 2.3 /100 | #228 | Tragic 17.7% |
| Immigrants | Guatemala | 2.2 /100 | #229 | Tragic 17.7% |
| Mongolians | 2.2 /100 | #230 | Tragic 17.7% |
| Guatemalans | 2.1 /100 | #231 | Tragic 17.8% |
| Tongans | 2.1 /100 | #232 | Tragic 17.8% |
| Panamanians | 2.1 /100 | #233 | Tragic 17.8% |
| Osage | 2.0 /100 | #234 | Tragic 17.8% |
| Spanish American Indians | 2.0 /100 | #235 | Tragic 17.8% |
| Immigrants | Iraq | 1.8 /100 | #236 | Tragic 17.8% |
| Immigrants | Mexico | 1.8 /100 | #237 | Tragic 17.8% |
| Cheyenne | 1.7 /100 | #238 | Tragic 17.8% |
| Cajuns | 1.4 /100 | #239 | Tragic 17.8% |
| Iraqis | 1.4 /100 | #240 | Tragic 17.8% |