Immigrants from Spain vs Moroccan Married-couple Households
COMPARE
Immigrants from Spain
Moroccan
Married-couple Households
Married-couple Households Comparison
Immigrants from Spain
Moroccans
45.3%
MARRIED-COUPLE HOUSEHOLDS
7.3/ 100
METRIC RATING
211th/ 347
METRIC RANK
43.5%
MARRIED-COUPLE HOUSEHOLDS
0.1/ 100
METRIC RATING
265th/ 347
METRIC RANK
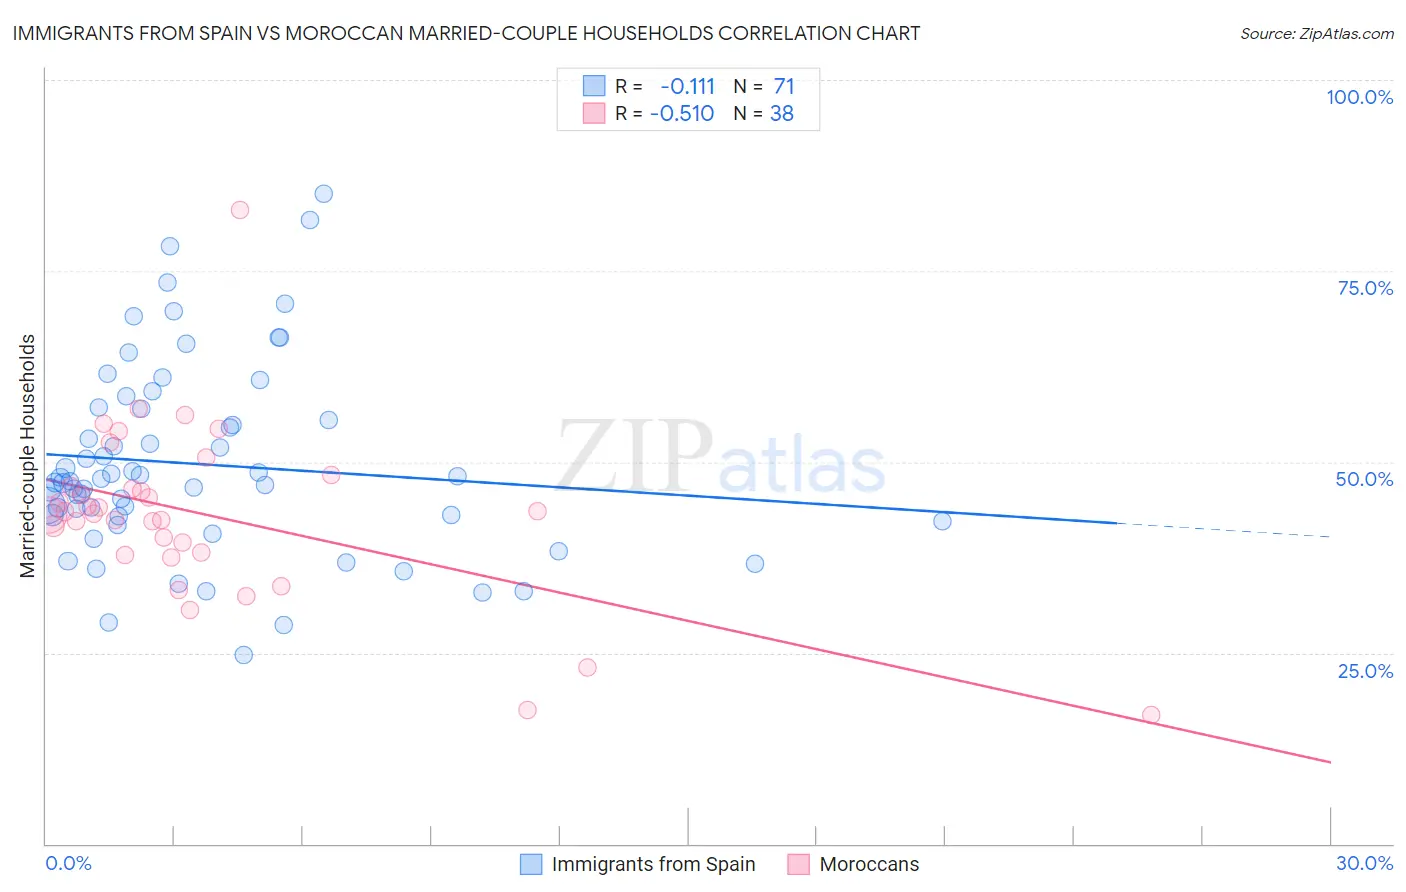
Immigrants from Spain vs Moroccan Married-couple Households Correlation Chart
The statistical analysis conducted on geographies consisting of 239,598,425 people shows a poor negative correlation between the proportion of Immigrants from Spain and percentage of married-couple family households in the United States with a correlation coefficient (R) of -0.111 and weighted average of 45.3%. Similarly, the statistical analysis conducted on geographies consisting of 201,755,880 people shows a substantial negative correlation between the proportion of Moroccans and percentage of married-couple family households in the United States with a correlation coefficient (R) of -0.510 and weighted average of 43.5%, a difference of 4.2%.
Married-couple Households Correlation Summary
| Measurement | Immigrants from Spain | Moroccan |
| Minimum | 24.7% | 16.8% |
| Maximum | 85.1% | 83.0% |
| Range | 60.3% | 66.2% |
| Mean | 49.7% | 43.1% |
| Median | 47.4% | 43.3% |
| Interquartile 25% (IQ1) | 42.8% | 38.2% |
| Interquartile 75% (IQ3) | 57.0% | 46.7% |
| Interquartile Range (IQR) | 14.2% | 8.5% |
| Standard Deviation (Sample) | 12.5% | 11.5% |
| Standard Deviation (Population) | 12.4% | 11.3% |
Similar Demographics by Married-couple Households
Demographics Similar to Immigrants from Spain by Married-couple Households
In terms of married-couple households, the demographic groups most similar to Immigrants from Spain are Cuban (45.4%, a difference of 0.050%), Creek (45.3%, a difference of 0.13%), Immigrants from Uzbekistan (45.4%, a difference of 0.14%), Immigrants from France (45.4%, a difference of 0.19%), and Hispanic or Latino (45.4%, a difference of 0.19%).
| Demographics | Rating | Rank | Married-couple Households |
| Aleuts | 12.5 /100 | #204 | Poor 45.6% |
| Nepalese | 11.9 /100 | #205 | Poor 45.6% |
| Uruguayans | 10.4 /100 | #206 | Poor 45.5% |
| Immigrants | France | 8.8 /100 | #207 | Tragic 45.4% |
| Hispanics or Latinos | 8.7 /100 | #208 | Tragic 45.4% |
| Immigrants | Uzbekistan | 8.4 /100 | #209 | Tragic 45.4% |
| Cubans | 7.7 /100 | #210 | Tragic 45.4% |
| Immigrants | Spain | 7.3 /100 | #211 | Tragic 45.3% |
| Creek | 6.4 /100 | #212 | Tragic 45.3% |
| Yakama | 5.8 /100 | #213 | Tragic 45.2% |
| Japanese | 5.7 /100 | #214 | Tragic 45.2% |
| Immigrants | Nepal | 5.6 /100 | #215 | Tragic 45.2% |
| Immigrants | Portugal | 5.6 /100 | #216 | Tragic 45.2% |
| Panamanians | 5.5 /100 | #217 | Tragic 45.2% |
| Immigrants | Azores | 5.3 /100 | #218 | Tragic 45.2% |
Demographics Similar to Moroccans by Married-couple Households
In terms of married-couple households, the demographic groups most similar to Moroccans are Ecuadorian (43.5%, a difference of 0.040%), Bangladeshi (43.5%, a difference of 0.080%), Native/Alaskan (43.5%, a difference of 0.090%), Cree (43.6%, a difference of 0.19%), and Immigrants from Burma/Myanmar (43.4%, a difference of 0.20%).
| Demographics | Rating | Rank | Married-couple Households |
| Central American Indians | 0.2 /100 | #258 | Tragic 43.8% |
| Iroquois | 0.2 /100 | #259 | Tragic 43.7% |
| Immigrants | Cameroon | 0.2 /100 | #260 | Tragic 43.7% |
| Alaskan Athabascans | 0.2 /100 | #261 | Tragic 43.6% |
| Vietnamese | 0.2 /100 | #262 | Tragic 43.6% |
| Cree | 0.1 /100 | #263 | Tragic 43.6% |
| Bangladeshis | 0.1 /100 | #264 | Tragic 43.5% |
| Moroccans | 0.1 /100 | #265 | Tragic 43.5% |
| Ecuadorians | 0.1 /100 | #266 | Tragic 43.5% |
| Natives/Alaskans | 0.1 /100 | #267 | Tragic 43.5% |
| Immigrants | Burma/Myanmar | 0.1 /100 | #268 | Tragic 43.4% |
| Immigrants | Sierra Leone | 0.1 /100 | #269 | Tragic 43.3% |
| Yuman | 0.1 /100 | #270 | Tragic 43.3% |
| Guatemalans | 0.1 /100 | #271 | Tragic 43.3% |
| Immigrants | Nigeria | 0.1 /100 | #272 | Tragic 43.2% |