Iraqi vs Alaska Native Currently Married
COMPARE
Iraqi
Alaska Native
Currently Married
Currently Married Comparison
Iraqis
Alaska Natives
46.9%
CURRENTLY MARRIED
66.4/ 100
METRIC RATING
159th/ 347
METRIC RANK
45.5%
CURRENTLY MARRIED
7.0/ 100
METRIC RATING
213th/ 347
METRIC RANK
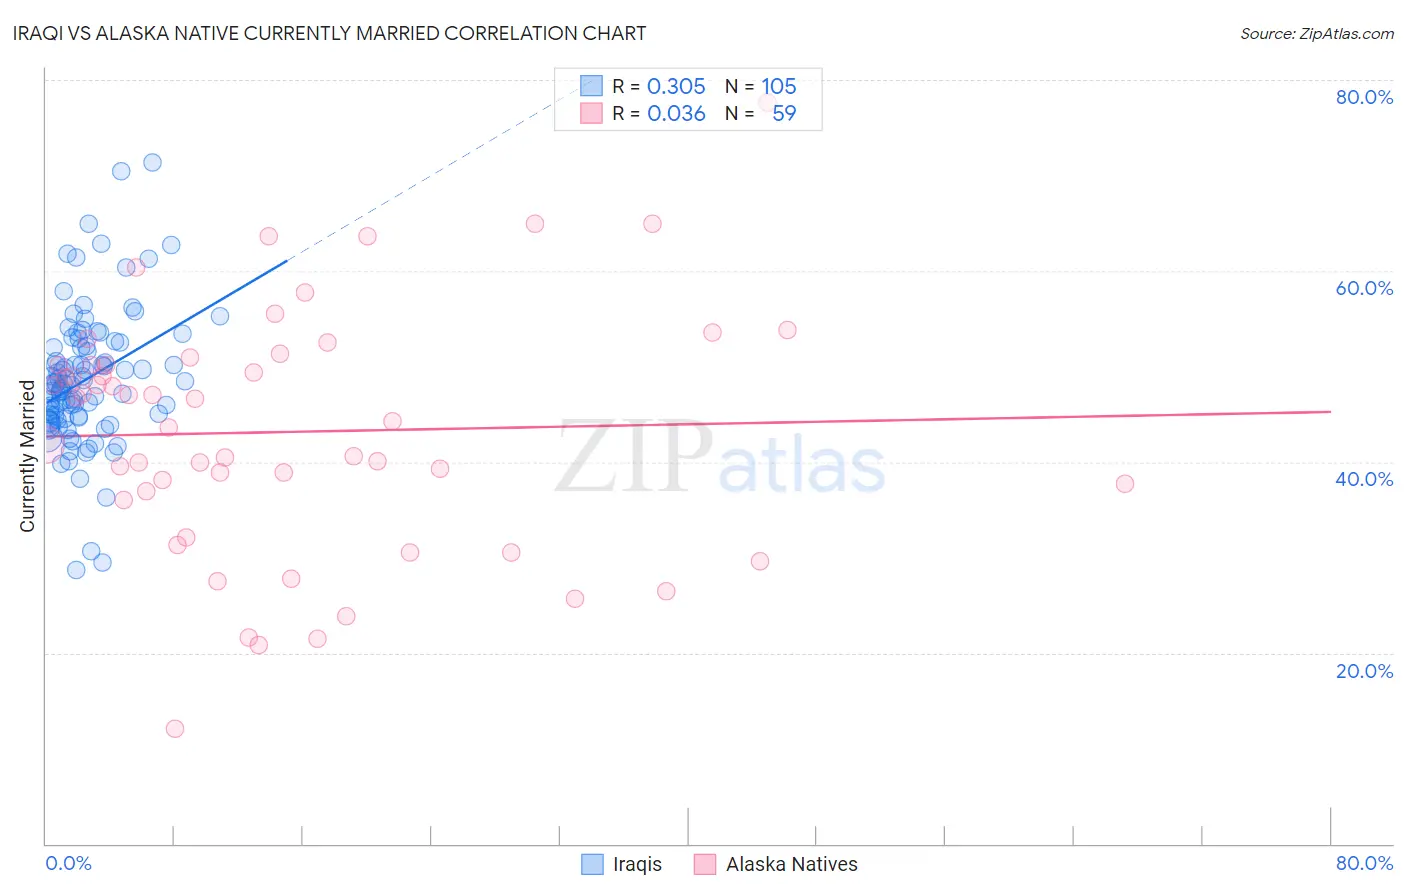
Iraqi vs Alaska Native Currently Married Correlation Chart
The statistical analysis conducted on geographies consisting of 170,656,152 people shows a mild positive correlation between the proportion of Iraqis and percentage of population currently married in the United States with a correlation coefficient (R) of 0.305 and weighted average of 46.9%. Similarly, the statistical analysis conducted on geographies consisting of 76,776,837 people shows no correlation between the proportion of Alaska Natives and percentage of population currently married in the United States with a correlation coefficient (R) of 0.036 and weighted average of 45.5%, a difference of 3.1%.
Currently Married Correlation Summary
| Measurement | Iraqi | Alaska Native |
| Minimum | 28.7% | 12.1% |
| Maximum | 71.4% | 77.7% |
| Range | 42.7% | 65.6% |
| Mean | 48.7% | 43.1% |
| Median | 48.1% | 44.2% |
| Interquartile 25% (IQ1) | 44.6% | 36.0% |
| Interquartile 75% (IQ3) | 52.3% | 50.2% |
| Interquartile Range (IQR) | 7.7% | 14.1% |
| Standard Deviation (Sample) | 7.1% | 12.8% |
| Standard Deviation (Population) | 7.1% | 12.7% |
Similar Demographics by Currently Married
Demographics Similar to Iraqis by Currently Married
In terms of currently married, the demographic groups most similar to Iraqis are Cherokee (46.9%, a difference of 0.020%), Immigrants from Uzbekistan (46.9%, a difference of 0.020%), Immigrants from Southern Europe (46.9%, a difference of 0.020%), Nonimmigrants (46.9%, a difference of 0.040%), and Immigrants from Switzerland (46.9%, a difference of 0.060%).
| Demographics | Rating | Rank | Currently Married |
| Immigrants | Serbia | 68.8 /100 | #152 | Good 47.0% |
| Immigrants | Venezuela | 68.6 /100 | #153 | Good 47.0% |
| Albanians | 68.6 /100 | #154 | Good 47.0% |
| Arabs | 68.6 /100 | #155 | Good 47.0% |
| Spanish | 68.1 /100 | #156 | Good 47.0% |
| Immigrants | Switzerland | 67.8 /100 | #157 | Good 46.9% |
| Cherokee | 66.8 /100 | #158 | Good 46.9% |
| Iraqis | 66.4 /100 | #159 | Good 46.9% |
| Immigrants | Uzbekistan | 66.0 /100 | #160 | Good 46.9% |
| Immigrants | Southern Europe | 65.9 /100 | #161 | Good 46.9% |
| Immigrants | Nonimmigrants | 65.4 /100 | #162 | Good 46.9% |
| Delaware | 64.7 /100 | #163 | Good 46.9% |
| Immigrants | Western Asia | 64.2 /100 | #164 | Good 46.9% |
| Samoans | 59.8 /100 | #165 | Average 46.8% |
| Immigrants | Syria | 59.3 /100 | #166 | Average 46.8% |
Demographics Similar to Alaska Natives by Currently Married
In terms of currently married, the demographic groups most similar to Alaska Natives are Marshallese (45.5%, a difference of 0.030%), Houma (45.5%, a difference of 0.040%), Dutch West Indian (45.5%, a difference of 0.040%), German Russian (45.5%, a difference of 0.040%), and Uruguayan (45.6%, a difference of 0.12%).
| Demographics | Rating | Rank | Currently Married |
| Immigrants | Immigrants | 11.2 /100 | #206 | Poor 45.8% |
| Immigrants | South America | 10.8 /100 | #207 | Poor 45.7% |
| Alsatians | 10.8 /100 | #208 | Poor 45.7% |
| Immigrants | Micronesia | 8.8 /100 | #209 | Tragic 45.6% |
| Uruguayans | 7.9 /100 | #210 | Tragic 45.6% |
| Houma | 7.2 /100 | #211 | Tragic 45.5% |
| Marshallese | 7.2 /100 | #212 | Tragic 45.5% |
| Alaska Natives | 7.0 /100 | #213 | Tragic 45.5% |
| Dutch West Indians | 6.7 /100 | #214 | Tragic 45.5% |
| German Russians | 6.7 /100 | #215 | Tragic 45.5% |
| Immigrants | Morocco | 5.5 /100 | #216 | Tragic 45.4% |
| Immigrants | Thailand | 5.1 /100 | #217 | Tragic 45.4% |
| Panamanians | 4.0 /100 | #218 | Tragic 45.3% |
| Immigrants | Portugal | 3.5 /100 | #219 | Tragic 45.2% |
| Kenyans | 3.1 /100 | #220 | Tragic 45.2% |