Iraqi vs Immigrants from Thailand Currently Married
COMPARE
Iraqi
Immigrants from Thailand
Currently Married
Currently Married Comparison
Iraqis
Immigrants from Thailand
46.9%
CURRENTLY MARRIED
66.4/ 100
METRIC RATING
159th/ 347
METRIC RANK
45.4%
CURRENTLY MARRIED
5.1/ 100
METRIC RATING
217th/ 347
METRIC RANK
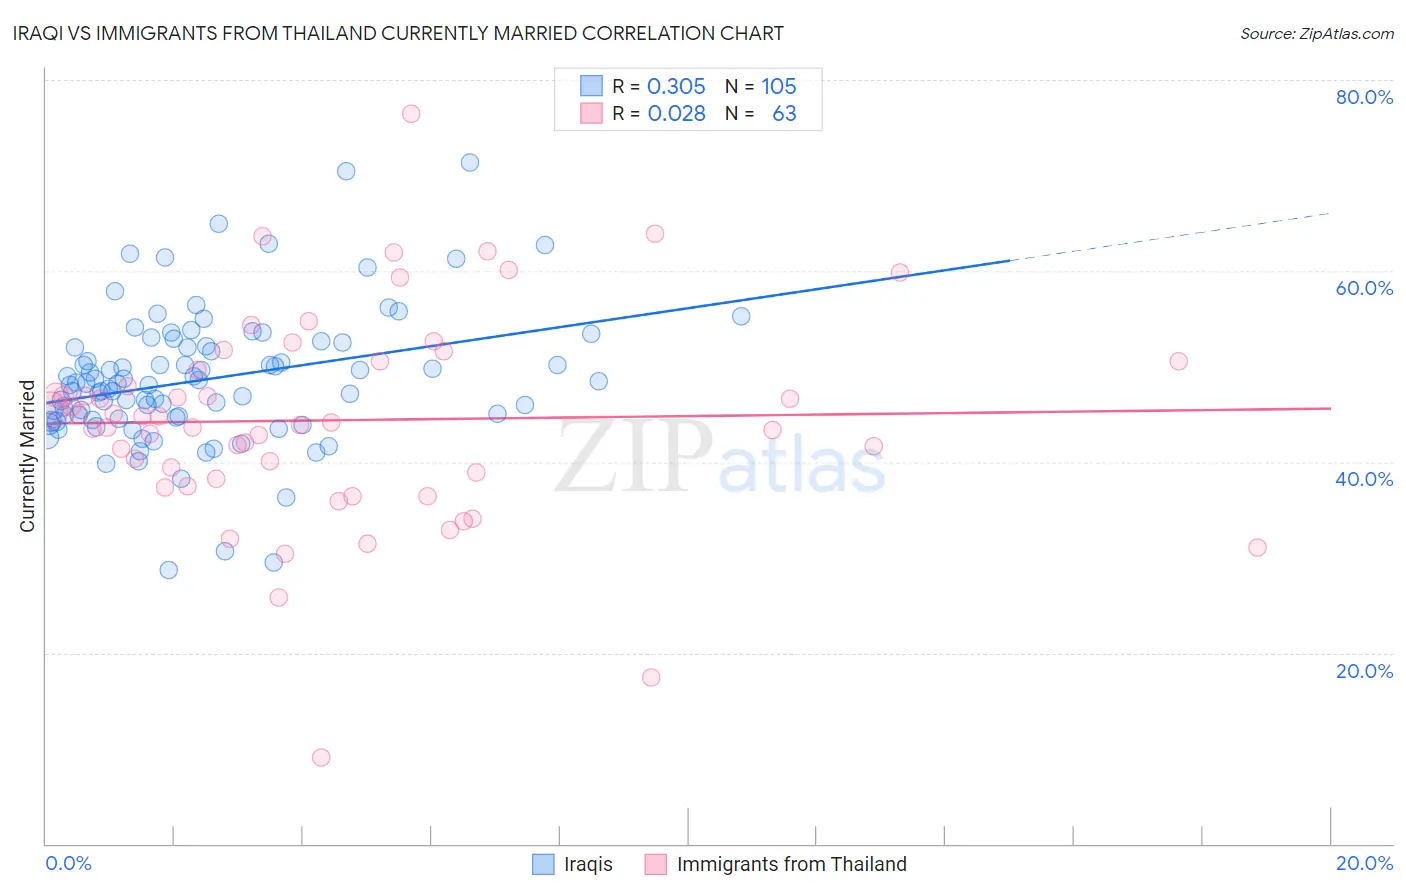
Iraqi vs Immigrants from Thailand Currently Married Correlation Chart
The statistical analysis conducted on geographies consisting of 170,656,152 people shows a mild positive correlation between the proportion of Iraqis and percentage of population currently married in the United States with a correlation coefficient (R) of 0.305 and weighted average of 46.9%. Similarly, the statistical analysis conducted on geographies consisting of 316,997,410 people shows no correlation between the proportion of Immigrants from Thailand and percentage of population currently married in the United States with a correlation coefficient (R) of 0.028 and weighted average of 45.4%, a difference of 3.4%.
Currently Married Correlation Summary
| Measurement | Iraqi | Immigrants from Thailand |
| Minimum | 28.7% | 9.0% |
| Maximum | 71.4% | 76.5% |
| Range | 42.7% | 67.5% |
| Mean | 48.7% | 44.4% |
| Median | 48.1% | 44.1% |
| Interquartile 25% (IQ1) | 44.6% | 38.3% |
| Interquartile 75% (IQ3) | 52.3% | 50.6% |
| Interquartile Range (IQR) | 7.7% | 12.3% |
| Standard Deviation (Sample) | 7.1% | 11.0% |
| Standard Deviation (Population) | 7.1% | 11.0% |
Similar Demographics by Currently Married
Demographics Similar to Iraqis by Currently Married
In terms of currently married, the demographic groups most similar to Iraqis are Cherokee (46.9%, a difference of 0.020%), Immigrants from Uzbekistan (46.9%, a difference of 0.020%), Immigrants from Southern Europe (46.9%, a difference of 0.020%), Nonimmigrants (46.9%, a difference of 0.040%), and Immigrants from Switzerland (46.9%, a difference of 0.060%).
| Demographics | Rating | Rank | Currently Married |
| Immigrants | Serbia | 68.8 /100 | #152 | Good 47.0% |
| Immigrants | Venezuela | 68.6 /100 | #153 | Good 47.0% |
| Albanians | 68.6 /100 | #154 | Good 47.0% |
| Arabs | 68.6 /100 | #155 | Good 47.0% |
| Spanish | 68.1 /100 | #156 | Good 47.0% |
| Immigrants | Switzerland | 67.8 /100 | #157 | Good 46.9% |
| Cherokee | 66.8 /100 | #158 | Good 46.9% |
| Iraqis | 66.4 /100 | #159 | Good 46.9% |
| Immigrants | Uzbekistan | 66.0 /100 | #160 | Good 46.9% |
| Immigrants | Southern Europe | 65.9 /100 | #161 | Good 46.9% |
| Immigrants | Nonimmigrants | 65.4 /100 | #162 | Good 46.9% |
| Delaware | 64.7 /100 | #163 | Good 46.9% |
| Immigrants | Western Asia | 64.2 /100 | #164 | Good 46.9% |
| Samoans | 59.8 /100 | #165 | Average 46.8% |
| Immigrants | Syria | 59.3 /100 | #166 | Average 46.8% |
Demographics Similar to Immigrants from Thailand by Currently Married
In terms of currently married, the demographic groups most similar to Immigrants from Thailand are Immigrants from Morocco (45.4%, a difference of 0.080%), Panamanian (45.3%, a difference of 0.24%), Dutch West Indian (45.5%, a difference of 0.28%), German Russian (45.5%, a difference of 0.28%), and Alaska Native (45.5%, a difference of 0.32%).
| Demographics | Rating | Rank | Currently Married |
| Uruguayans | 7.9 /100 | #210 | Tragic 45.6% |
| Houma | 7.2 /100 | #211 | Tragic 45.5% |
| Marshallese | 7.2 /100 | #212 | Tragic 45.5% |
| Alaska Natives | 7.0 /100 | #213 | Tragic 45.5% |
| Dutch West Indians | 6.7 /100 | #214 | Tragic 45.5% |
| German Russians | 6.7 /100 | #215 | Tragic 45.5% |
| Immigrants | Morocco | 5.5 /100 | #216 | Tragic 45.4% |
| Immigrants | Thailand | 5.1 /100 | #217 | Tragic 45.4% |
| Panamanians | 4.0 /100 | #218 | Tragic 45.3% |
| Immigrants | Portugal | 3.5 /100 | #219 | Tragic 45.2% |
| Kenyans | 3.1 /100 | #220 | Tragic 45.2% |
| Mexicans | 3.0 /100 | #221 | Tragic 45.2% |
| Immigrants | Azores | 2.5 /100 | #222 | Tragic 45.1% |
| Immigrants | Laos | 2.3 /100 | #223 | Tragic 45.0% |
| Immigrants | Uganda | 2.2 /100 | #224 | Tragic 45.0% |