Iraqi vs Immigrants from Albania Family Households
COMPARE
Iraqi
Immigrants from Albania
Family Households
Family Households Comparison
Iraqis
Immigrants from Albania
64.4%
FAMILY HOUSEHOLDS
56.0/ 100
METRIC RATING
169th/ 347
METRIC RANK
62.4%
FAMILY HOUSEHOLDS
0.0/ 100
METRIC RATING
301st/ 347
METRIC RANK
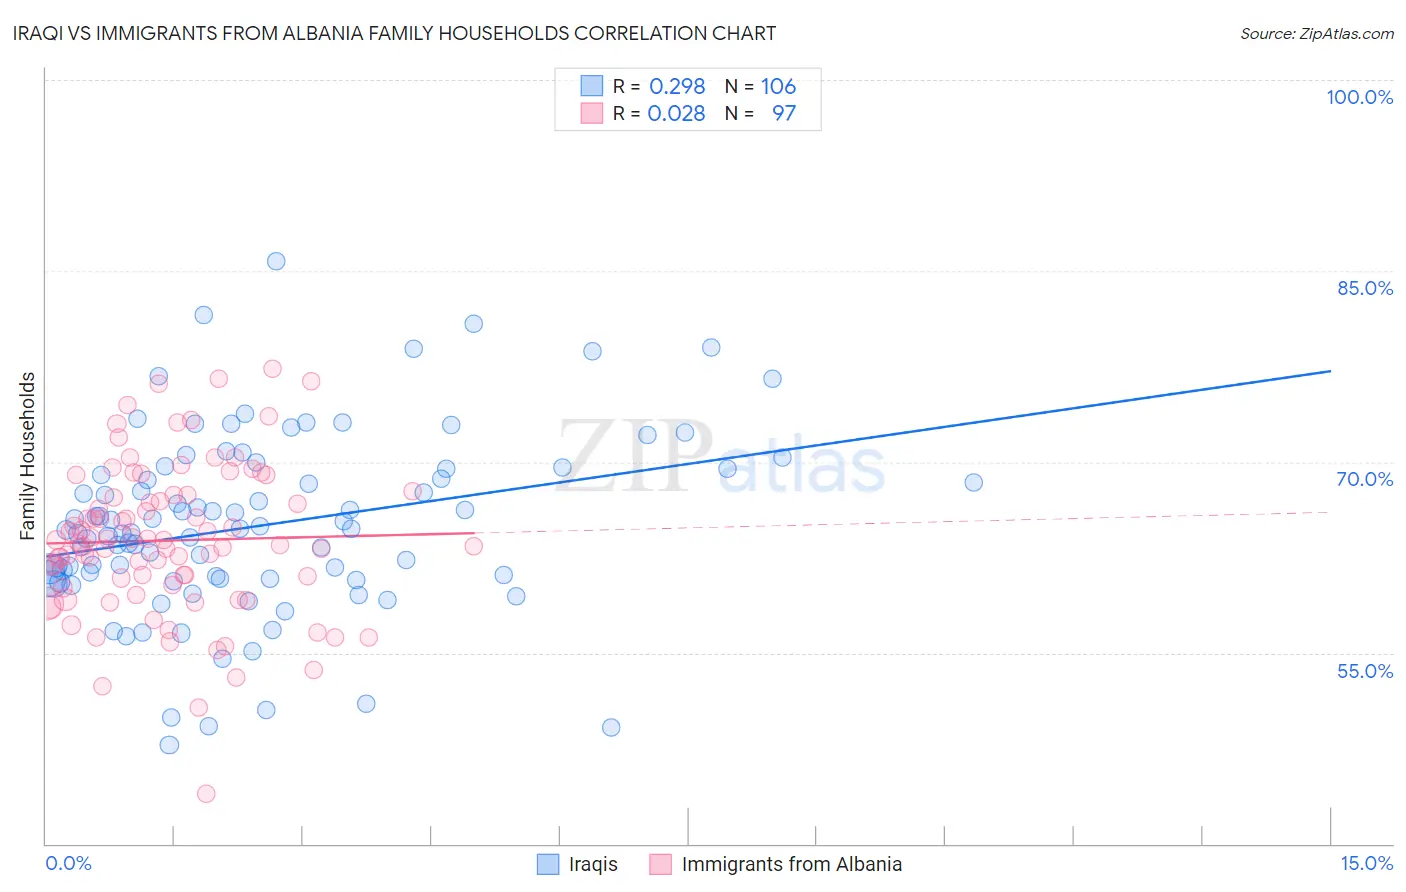
Iraqi vs Immigrants from Albania Family Households Correlation Chart
The statistical analysis conducted on geographies consisting of 170,639,485 people shows a weak positive correlation between the proportion of Iraqis and percentage of family households in the United States with a correlation coefficient (R) of 0.298 and weighted average of 64.4%. Similarly, the statistical analysis conducted on geographies consisting of 119,383,299 people shows no correlation between the proportion of Immigrants from Albania and percentage of family households in the United States with a correlation coefficient (R) of 0.028 and weighted average of 62.4%, a difference of 3.2%.
Family Households Correlation Summary
| Measurement | Iraqi | Immigrants from Albania |
| Minimum | 47.7% | 44.0% |
| Maximum | 85.7% | 77.4% |
| Range | 38.0% | 33.4% |
| Mean | 65.0% | 63.8% |
| Median | 64.7% | 63.6% |
| Interquartile 25% (IQ1) | 60.8% | 60.2% |
| Interquartile 75% (IQ3) | 69.4% | 67.4% |
| Interquartile Range (IQR) | 8.6% | 7.2% |
| Standard Deviation (Sample) | 7.1% | 6.0% |
| Standard Deviation (Population) | 7.1% | 6.0% |
Similar Demographics by Family Households
Demographics Similar to Iraqis by Family Households
In terms of family households, the demographic groups most similar to Iraqis are Armenian (64.4%, a difference of 0.0%), Honduran (64.4%, a difference of 0.020%), Ute (64.3%, a difference of 0.020%), Irish (64.4%, a difference of 0.030%), and Dutch West Indian (64.3%, a difference of 0.030%).
| Demographics | Rating | Rank | Family Households |
| British | 61.6 /100 | #162 | Good 64.4% |
| Chickasaw | 61.5 /100 | #163 | Good 64.4% |
| Immigrants | Nigeria | 60.1 /100 | #164 | Good 64.4% |
| Immigrants | Southern Europe | 60.0 /100 | #165 | Good 64.4% |
| Scotch-Irish | 59.2 /100 | #166 | Average 64.4% |
| Irish | 57.9 /100 | #167 | Average 64.4% |
| Hondurans | 57.5 /100 | #168 | Average 64.4% |
| Iraqis | 56.0 /100 | #169 | Average 64.4% |
| Armenians | 55.9 /100 | #170 | Average 64.4% |
| Ute | 54.6 /100 | #171 | Average 64.3% |
| Dutch West Indians | 53.9 /100 | #172 | Average 64.3% |
| Immigrants | Sierra Leone | 52.5 /100 | #173 | Average 64.3% |
| Immigrants | Germany | 50.0 /100 | #174 | Average 64.3% |
| Bangladeshis | 44.3 /100 | #175 | Average 64.3% |
| Vietnamese | 43.6 /100 | #176 | Average 64.2% |
Demographics Similar to Immigrants from Albania by Family Households
In terms of family households, the demographic groups most similar to Immigrants from Albania are Immigrants from Africa (62.4%, a difference of 0.020%), Immigrants from Kuwait (62.4%, a difference of 0.030%), Immigrants from Kenya (62.3%, a difference of 0.040%), Immigrants from Spain (62.4%, a difference of 0.090%), and Cree (62.3%, a difference of 0.10%).
| Demographics | Rating | Rank | Family Households |
| Barbadians | 0.0 /100 | #294 | Tragic 62.5% |
| Okinawans | 0.0 /100 | #295 | Tragic 62.5% |
| Slovenes | 0.0 /100 | #296 | Tragic 62.4% |
| French American Indians | 0.0 /100 | #297 | Tragic 62.4% |
| Immigrants | Spain | 0.0 /100 | #298 | Tragic 62.4% |
| Immigrants | Kuwait | 0.0 /100 | #299 | Tragic 62.4% |
| Immigrants | Africa | 0.0 /100 | #300 | Tragic 62.4% |
| Immigrants | Albania | 0.0 /100 | #301 | Tragic 62.4% |
| Immigrants | Kenya | 0.0 /100 | #302 | Tragic 62.3% |
| Cree | 0.0 /100 | #303 | Tragic 62.3% |
| Iroquois | 0.0 /100 | #304 | Tragic 62.2% |
| Bermudans | 0.0 /100 | #305 | Tragic 62.2% |
| Africans | 0.0 /100 | #306 | Tragic 62.1% |
| Immigrants | Norway | 0.0 /100 | #307 | Tragic 62.1% |
| Chippewa | 0.0 /100 | #308 | Tragic 62.1% |