Iraqi vs Immigrants from St. Vincent and the Grenadines Currently Married
COMPARE
Iraqi
Immigrants from St. Vincent and the Grenadines
Currently Married
Currently Married Comparison
Iraqis
Immigrants from St. Vincent and the Grenadines
46.9%
CURRENTLY MARRIED
66.4/ 100
METRIC RATING
159th/ 347
METRIC RANK
40.1%
CURRENTLY MARRIED
0.0/ 100
METRIC RATING
332nd/ 347
METRIC RANK
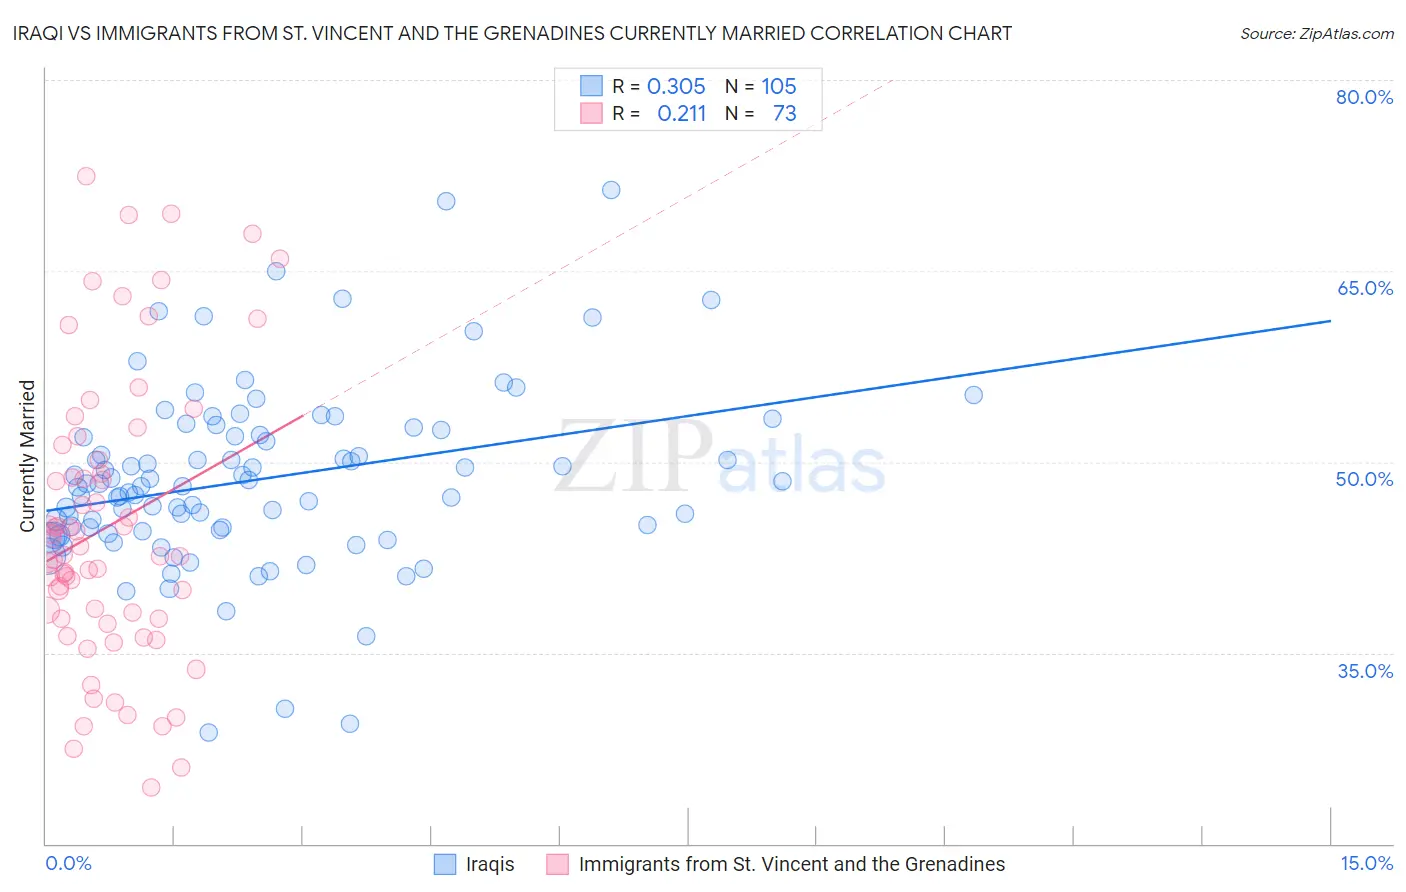
Iraqi vs Immigrants from St. Vincent and the Grenadines Currently Married Correlation Chart
The statistical analysis conducted on geographies consisting of 170,656,152 people shows a mild positive correlation between the proportion of Iraqis and percentage of population currently married in the United States with a correlation coefficient (R) of 0.305 and weighted average of 46.9%. Similarly, the statistical analysis conducted on geographies consisting of 56,191,418 people shows a weak positive correlation between the proportion of Immigrants from St. Vincent and the Grenadines and percentage of population currently married in the United States with a correlation coefficient (R) of 0.211 and weighted average of 40.1%, a difference of 17.1%.
Currently Married Correlation Summary
| Measurement | Iraqi | Immigrants from St. Vincent and the Grenadines |
| Minimum | 28.7% | 24.4% |
| Maximum | 71.4% | 72.4% |
| Range | 42.7% | 48.0% |
| Mean | 48.7% | 44.9% |
| Median | 48.1% | 42.7% |
| Interquartile 25% (IQ1) | 44.6% | 37.7% |
| Interquartile 75% (IQ3) | 52.3% | 50.7% |
| Interquartile Range (IQR) | 7.7% | 13.0% |
| Standard Deviation (Sample) | 7.1% | 11.2% |
| Standard Deviation (Population) | 7.1% | 11.1% |
Similar Demographics by Currently Married
Demographics Similar to Iraqis by Currently Married
In terms of currently married, the demographic groups most similar to Iraqis are Cherokee (46.9%, a difference of 0.020%), Immigrants from Uzbekistan (46.9%, a difference of 0.020%), Immigrants from Southern Europe (46.9%, a difference of 0.020%), Nonimmigrants (46.9%, a difference of 0.040%), and Immigrants from Switzerland (46.9%, a difference of 0.060%).
| Demographics | Rating | Rank | Currently Married |
| Immigrants | Serbia | 68.8 /100 | #152 | Good 47.0% |
| Immigrants | Venezuela | 68.6 /100 | #153 | Good 47.0% |
| Albanians | 68.6 /100 | #154 | Good 47.0% |
| Arabs | 68.6 /100 | #155 | Good 47.0% |
| Spanish | 68.1 /100 | #156 | Good 47.0% |
| Immigrants | Switzerland | 67.8 /100 | #157 | Good 46.9% |
| Cherokee | 66.8 /100 | #158 | Good 46.9% |
| Iraqis | 66.4 /100 | #159 | Good 46.9% |
| Immigrants | Uzbekistan | 66.0 /100 | #160 | Good 46.9% |
| Immigrants | Southern Europe | 65.9 /100 | #161 | Good 46.9% |
| Immigrants | Nonimmigrants | 65.4 /100 | #162 | Good 46.9% |
| Delaware | 64.7 /100 | #163 | Good 46.9% |
| Immigrants | Western Asia | 64.2 /100 | #164 | Good 46.9% |
| Samoans | 59.8 /100 | #165 | Average 46.8% |
| Immigrants | Syria | 59.3 /100 | #166 | Average 46.8% |
Demographics Similar to Immigrants from St. Vincent and the Grenadines by Currently Married
In terms of currently married, the demographic groups most similar to Immigrants from St. Vincent and the Grenadines are Yup'ik (39.9%, a difference of 0.39%), Puerto Rican (39.9%, a difference of 0.41%), Lumbee (39.8%, a difference of 0.57%), Immigrants from Barbados (40.3%, a difference of 0.67%), and Immigrants from Dominica (40.3%, a difference of 0.69%).
| Demographics | Rating | Rank | Currently Married |
| U.S. Virgin Islanders | 0.0 /100 | #325 | Tragic 40.7% |
| Barbadians | 0.0 /100 | #326 | Tragic 40.6% |
| Senegalese | 0.0 /100 | #327 | Tragic 40.6% |
| Arapaho | 0.0 /100 | #328 | Tragic 40.5% |
| Crow | 0.0 /100 | #329 | Tragic 40.4% |
| Immigrants | Dominica | 0.0 /100 | #330 | Tragic 40.3% |
| Immigrants | Barbados | 0.0 /100 | #331 | Tragic 40.3% |
| Immigrants | St. Vincent and the Grenadines | 0.0 /100 | #332 | Tragic 40.1% |
| Yup'ik | 0.0 /100 | #333 | Tragic 39.9% |
| Puerto Ricans | 0.0 /100 | #334 | Tragic 39.9% |
| Lumbee | 0.0 /100 | #335 | Tragic 39.8% |
| British West Indians | 0.0 /100 | #336 | Tragic 39.8% |
| Blacks/African Americans | 0.0 /100 | #337 | Tragic 39.6% |
| Cape Verdeans | 0.0 /100 | #338 | Tragic 39.6% |
| Dominicans | 0.0 /100 | #339 | Tragic 39.5% |