Immigrants from Albania vs Creek Family Households
COMPARE
Immigrants from Albania
Creek
Family Households
Family Households Comparison
Immigrants from Albania
Creek
62.4%
FAMILY HOUSEHOLDS
0.0/ 100
METRIC RATING
301st/ 347
METRIC RANK
64.2%
FAMILY HOUSEHOLDS
34.1/ 100
METRIC RATING
183rd/ 347
METRIC RANK
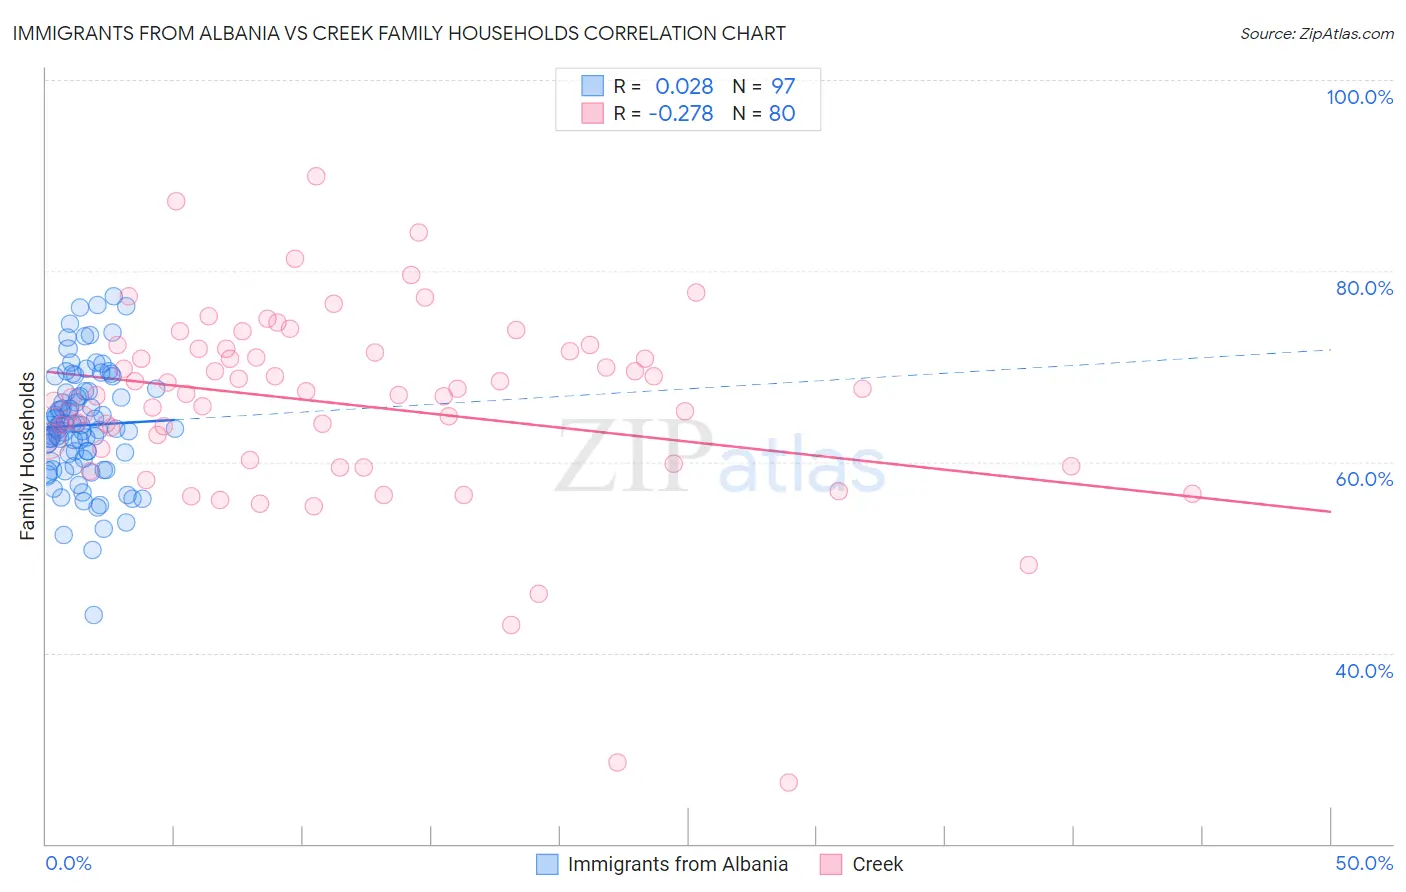
Immigrants from Albania vs Creek Family Households Correlation Chart
The statistical analysis conducted on geographies consisting of 119,383,299 people shows no correlation between the proportion of Immigrants from Albania and percentage of family households in the United States with a correlation coefficient (R) of 0.028 and weighted average of 62.4%. Similarly, the statistical analysis conducted on geographies consisting of 178,433,480 people shows a weak negative correlation between the proportion of Creek and percentage of family households in the United States with a correlation coefficient (R) of -0.278 and weighted average of 64.2%, a difference of 2.9%.
Family Households Correlation Summary
| Measurement | Immigrants from Albania | Creek |
| Minimum | 44.0% | 26.4% |
| Maximum | 77.4% | 89.9% |
| Range | 33.4% | 63.5% |
| Mean | 63.8% | 66.0% |
| Median | 63.6% | 67.1% |
| Interquartile 25% (IQ1) | 60.2% | 60.8% |
| Interquartile 75% (IQ3) | 67.4% | 71.7% |
| Interquartile Range (IQR) | 7.2% | 10.9% |
| Standard Deviation (Sample) | 6.0% | 10.4% |
| Standard Deviation (Population) | 6.0% | 10.3% |
Similar Demographics by Family Households
Demographics Similar to Immigrants from Albania by Family Households
In terms of family households, the demographic groups most similar to Immigrants from Albania are Immigrants from Africa (62.4%, a difference of 0.020%), Immigrants from Kuwait (62.4%, a difference of 0.030%), Immigrants from Kenya (62.3%, a difference of 0.040%), Immigrants from Spain (62.4%, a difference of 0.090%), and Cree (62.3%, a difference of 0.10%).
| Demographics | Rating | Rank | Family Households |
| Barbadians | 0.0 /100 | #294 | Tragic 62.5% |
| Okinawans | 0.0 /100 | #295 | Tragic 62.5% |
| Slovenes | 0.0 /100 | #296 | Tragic 62.4% |
| French American Indians | 0.0 /100 | #297 | Tragic 62.4% |
| Immigrants | Spain | 0.0 /100 | #298 | Tragic 62.4% |
| Immigrants | Kuwait | 0.0 /100 | #299 | Tragic 62.4% |
| Immigrants | Africa | 0.0 /100 | #300 | Tragic 62.4% |
| Immigrants | Albania | 0.0 /100 | #301 | Tragic 62.4% |
| Immigrants | Kenya | 0.0 /100 | #302 | Tragic 62.3% |
| Cree | 0.0 /100 | #303 | Tragic 62.3% |
| Iroquois | 0.0 /100 | #304 | Tragic 62.2% |
| Bermudans | 0.0 /100 | #305 | Tragic 62.2% |
| Africans | 0.0 /100 | #306 | Tragic 62.1% |
| Immigrants | Norway | 0.0 /100 | #307 | Tragic 62.1% |
| Chippewa | 0.0 /100 | #308 | Tragic 62.1% |
Demographics Similar to Creek by Family Households
In terms of family households, the demographic groups most similar to Creek are Immigrants from Honduras (64.2%, a difference of 0.010%), Immigrants from Trinidad and Tobago (64.2%, a difference of 0.010%), Ukrainian (64.2%, a difference of 0.010%), Puerto Rican (64.2%, a difference of 0.010%), and Immigrants from Ukraine (64.2%, a difference of 0.060%).
| Demographics | Rating | Rank | Family Households |
| Vietnamese | 43.6 /100 | #176 | Average 64.2% |
| Immigrants | Micronesia | 42.3 /100 | #177 | Average 64.2% |
| Jamaicans | 40.6 /100 | #178 | Average 64.2% |
| Immigrants | Ukraine | 38.2 /100 | #179 | Fair 64.2% |
| Immigrants | Honduras | 35.0 /100 | #180 | Fair 64.2% |
| Immigrants | Trinidad and Tobago | 34.9 /100 | #181 | Fair 64.2% |
| Ukrainians | 34.6 /100 | #182 | Fair 64.2% |
| Creek | 34.1 /100 | #183 | Fair 64.2% |
| Puerto Ricans | 33.4 /100 | #184 | Fair 64.2% |
| Immigrants | Iran | 30.4 /100 | #185 | Fair 64.1% |
| Spanish Americans | 30.1 /100 | #186 | Fair 64.1% |
| Northern Europeans | 28.2 /100 | #187 | Fair 64.1% |
| Paraguayans | 26.7 /100 | #188 | Fair 64.1% |
| Immigrants | Western Asia | 25.3 /100 | #189 | Fair 64.1% |
| Zimbabweans | 24.7 /100 | #190 | Fair 64.1% |