Immigrants from Cambodia vs Bangladeshi Average Family Size
COMPARE
Immigrants from Cambodia
Bangladeshi
Average Family Size
Average Family Size Comparison
Immigrants from Cambodia
Bangladeshis
3.33
AVERAGE FAMILY SIZE
99.9/ 100
METRIC RATING
68th/ 347
METRIC RANK
3.37
AVERAGE FAMILY SIZE
100.0/ 100
METRIC RATING
49th/ 347
METRIC RANK
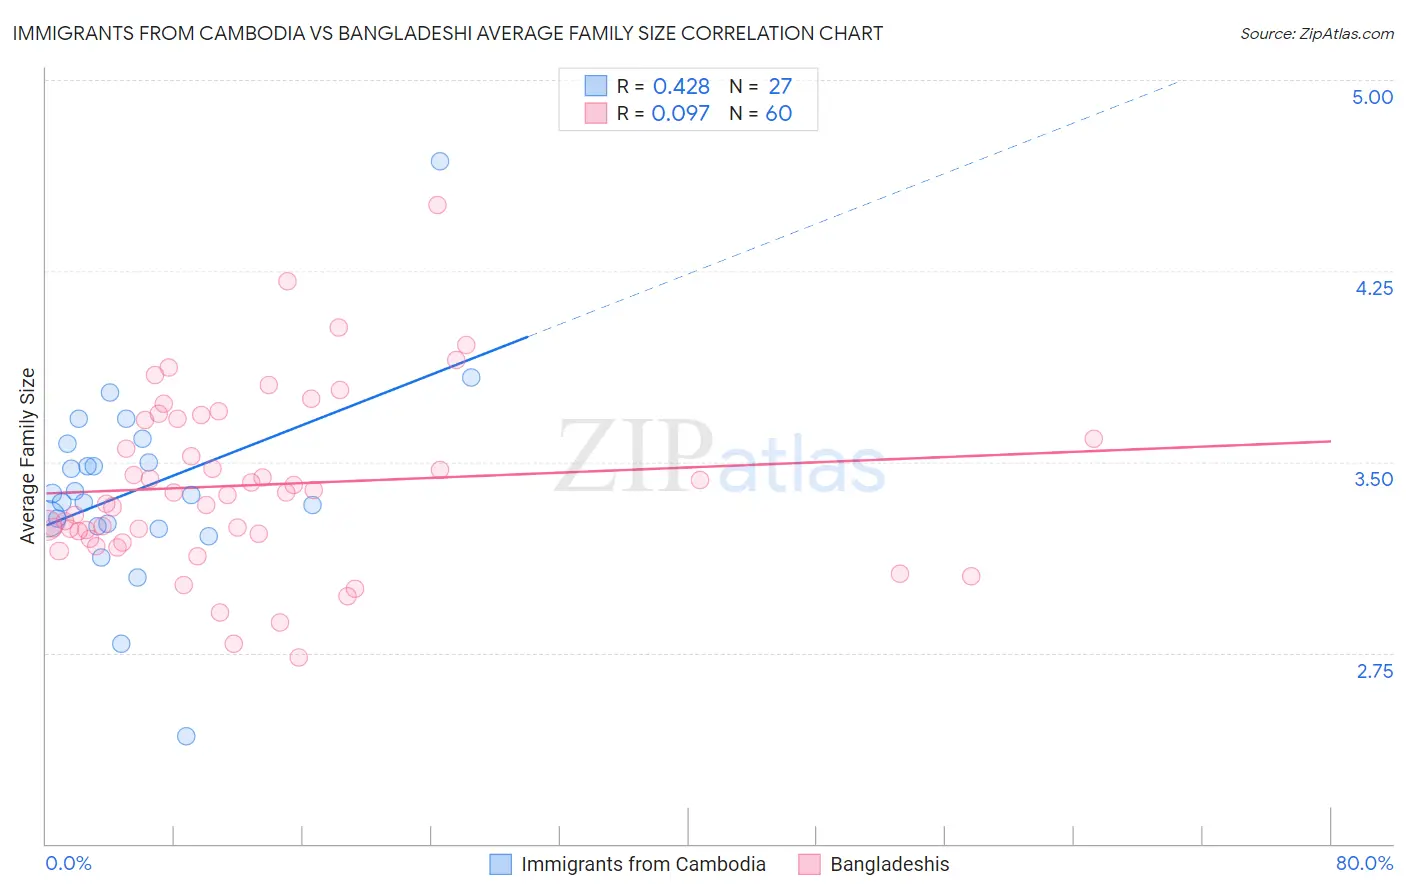
Immigrants from Cambodia vs Bangladeshi Average Family Size Correlation Chart
The statistical analysis conducted on geographies consisting of 205,129,465 people shows a moderate positive correlation between the proportion of Immigrants from Cambodia and average family size in the United States with a correlation coefficient (R) of 0.428 and weighted average of 3.33. Similarly, the statistical analysis conducted on geographies consisting of 141,330,696 people shows a slight positive correlation between the proportion of Bangladeshis and average family size in the United States with a correlation coefficient (R) of 0.097 and weighted average of 3.37, a difference of 1.1%.
Average Family Size Correlation Summary
| Measurement | Immigrants from Cambodia | Bangladeshi |
| Minimum | 2.42 | 2.73 |
| Maximum | 4.68 | 4.51 |
| Range | 2.26 | 1.78 |
| Mean | 3.40 | 3.41 |
| Median | 3.37 | 3.37 |
| Interquartile 25% (IQ1) | 3.25 | 3.21 |
| Interquartile 75% (IQ3) | 3.57 | 3.67 |
| Interquartile Range (IQR) | 0.32 | 0.46 |
| Standard Deviation (Sample) | 0.39 | 0.34 |
| Standard Deviation (Population) | 0.38 | 0.34 |
Demographics Similar to Immigrants from Cambodia and Bangladeshis by Average Family Size
In terms of average family size, the demographic groups most similar to Immigrants from Cambodia are Immigrants from Jamaica (3.33, a difference of 0.080%), Immigrants from St. Vincent and the Grenadines (3.34, a difference of 0.12%), Immigrants from Laos (3.34, a difference of 0.18%), Dominican (3.34, a difference of 0.21%), and Chinese (3.34, a difference of 0.28%). Similarly, the demographic groups most similar to Bangladeshis are Immigrants from Nicaragua (3.37, a difference of 0.060%), Immigrants from Bangladesh (3.36, a difference of 0.14%), Nicaraguan (3.36, a difference of 0.21%), Fijian (3.36, a difference of 0.26%), and Korean (3.36, a difference of 0.29%).
| Demographics | Rating | Rank | Average Family Size |
| Immigrants | Nicaragua | 100.0 /100 | #48 | Exceptional 3.37 |
| Bangladeshis | 100.0 /100 | #49 | Exceptional 3.37 |
| Immigrants | Bangladesh | 100.0 /100 | #50 | Exceptional 3.36 |
| Nicaraguans | 100.0 /100 | #51 | Exceptional 3.36 |
| Fijians | 100.0 /100 | #52 | Exceptional 3.36 |
| Koreans | 100.0 /100 | #53 | Exceptional 3.36 |
| Immigrants | South Eastern Asia | 100.0 /100 | #54 | Exceptional 3.36 |
| Immigrants | Honduras | 100.0 /100 | #55 | Exceptional 3.36 |
| Immigrants | Dominican Republic | 100.0 /100 | #56 | Exceptional 3.35 |
| Sri Lankans | 100.0 /100 | #57 | Exceptional 3.35 |
| Hondurans | 100.0 /100 | #58 | Exceptional 3.35 |
| Japanese | 100.0 /100 | #59 | Exceptional 3.35 |
| Immigrants | Armenia | 100.0 /100 | #60 | Exceptional 3.35 |
| Central American Indians | 100.0 /100 | #61 | Exceptional 3.35 |
| Immigrants | Grenada | 100.0 /100 | #62 | Exceptional 3.34 |
| Chinese | 100.0 /100 | #63 | Exceptional 3.34 |
| Dominicans | 99.9 /100 | #64 | Exceptional 3.34 |
| Immigrants | Laos | 99.9 /100 | #65 | Exceptional 3.34 |
| Immigrants | St. Vincent and the Grenadines | 99.9 /100 | #66 | Exceptional 3.34 |
| Immigrants | Jamaica | 99.9 /100 | #67 | Exceptional 3.33 |
| Immigrants | Cambodia | 99.9 /100 | #68 | Exceptional 3.33 |