Immigrants from Belarus vs Bangladeshi Average Family Size
COMPARE
Immigrants from Belarus
Bangladeshi
Average Family Size
Average Family Size Comparison
Immigrants from Belarus
Bangladeshis
3.17
AVERAGE FAMILY SIZE
2.3/ 100
METRIC RATING
248th/ 347
METRIC RANK
3.37
AVERAGE FAMILY SIZE
100.0/ 100
METRIC RATING
49th/ 347
METRIC RANK
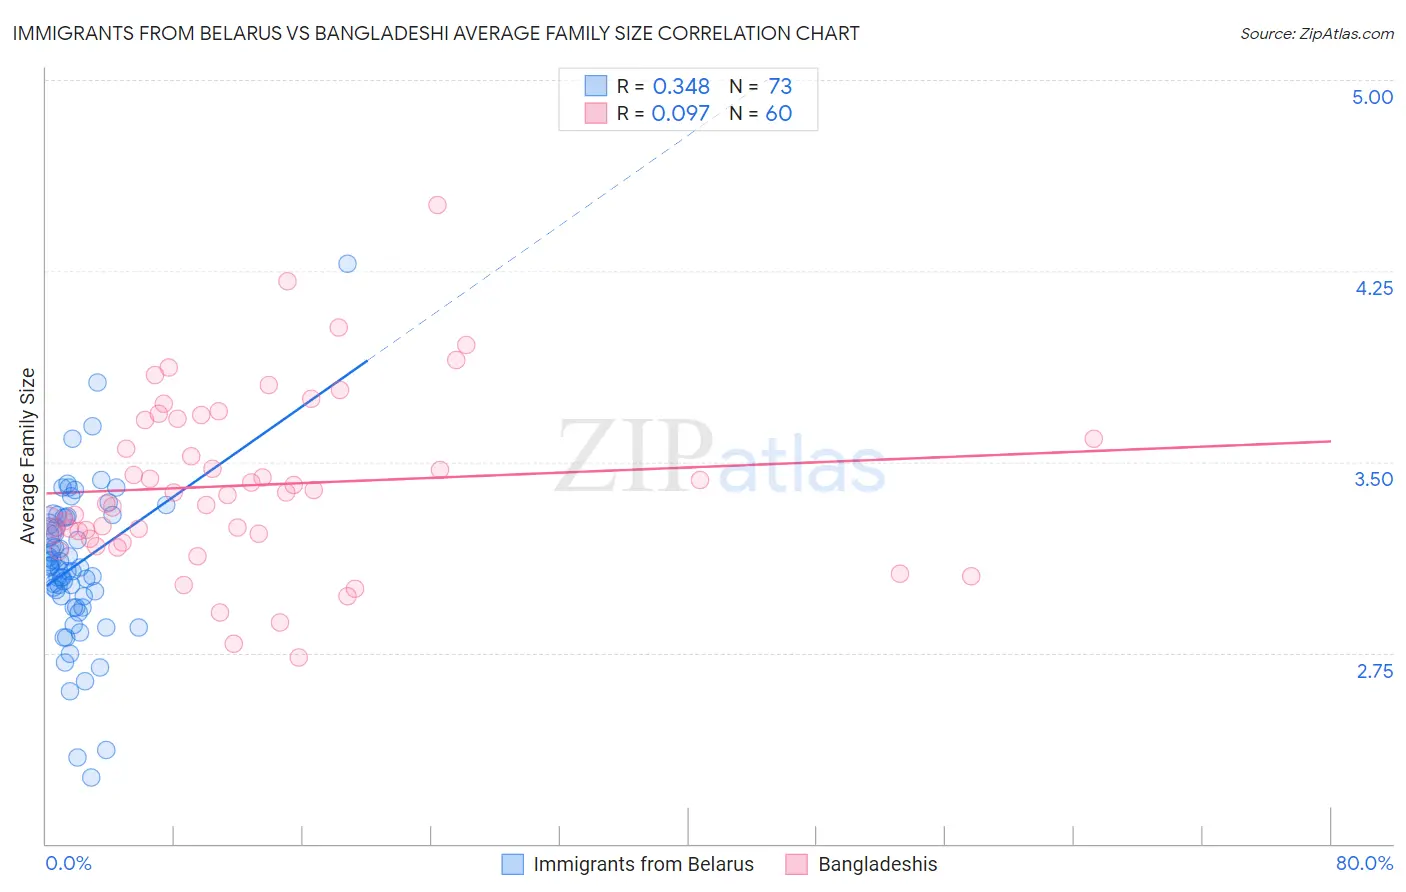
Immigrants from Belarus vs Bangladeshi Average Family Size Correlation Chart
The statistical analysis conducted on geographies consisting of 150,189,025 people shows a mild positive correlation between the proportion of Immigrants from Belarus and average family size in the United States with a correlation coefficient (R) of 0.348 and weighted average of 3.17. Similarly, the statistical analysis conducted on geographies consisting of 141,330,696 people shows a slight positive correlation between the proportion of Bangladeshis and average family size in the United States with a correlation coefficient (R) of 0.097 and weighted average of 3.37, a difference of 6.1%.
Average Family Size Correlation Summary
| Measurement | Immigrants from Belarus | Bangladeshi |
| Minimum | 2.26 | 2.73 |
| Maximum | 4.28 | 4.51 |
| Range | 2.02 | 1.78 |
| Mean | 3.10 | 3.41 |
| Median | 3.09 | 3.37 |
| Interquartile 25% (IQ1) | 2.95 | 3.21 |
| Interquartile 75% (IQ3) | 3.28 | 3.67 |
| Interquartile Range (IQR) | 0.33 | 0.46 |
| Standard Deviation (Sample) | 0.31 | 0.34 |
| Standard Deviation (Population) | 0.31 | 0.34 |
Similar Demographics by Average Family Size
Demographics Similar to Immigrants from Belarus by Average Family Size
In terms of average family size, the demographic groups most similar to Immigrants from Belarus are Cajun (3.17, a difference of 0.030%), Danish (3.17, a difference of 0.040%), Immigrants from Eastern Europe (3.17, a difference of 0.040%), Immigrants from Brazil (3.18, a difference of 0.080%), and Puget Sound Salish (3.17, a difference of 0.10%).
| Demographics | Rating | Rank | Average Family Size |
| Immigrants | Japan | 3.0 /100 | #241 | Tragic 3.18 |
| Hungarians | 3.0 /100 | #242 | Tragic 3.18 |
| Immigrants | Moldova | 2.9 /100 | #243 | Tragic 3.18 |
| Immigrants | Southern Europe | 2.9 /100 | #244 | Tragic 3.18 |
| Immigrants | Brazil | 2.7 /100 | #245 | Tragic 3.18 |
| Danes | 2.5 /100 | #246 | Tragic 3.17 |
| Cajuns | 2.4 /100 | #247 | Tragic 3.17 |
| Immigrants | Belarus | 2.3 /100 | #248 | Tragic 3.17 |
| Immigrants | Eastern Europe | 2.1 /100 | #249 | Tragic 3.17 |
| Puget Sound Salish | 1.9 /100 | #250 | Tragic 3.17 |
| Immigrants | Spain | 1.8 /100 | #251 | Tragic 3.17 |
| Immigrants | Saudi Arabia | 1.7 /100 | #252 | Tragic 3.17 |
| South Africans | 1.7 /100 | #253 | Tragic 3.17 |
| Immigrants | Hungary | 1.7 /100 | #254 | Tragic 3.17 |
| Cape Verdeans | 1.6 /100 | #255 | Tragic 3.17 |
Demographics Similar to Bangladeshis by Average Family Size
In terms of average family size, the demographic groups most similar to Bangladeshis are Immigrants from Nicaragua (3.37, a difference of 0.060%), Vietnamese (3.37, a difference of 0.070%), Haitian (3.37, a difference of 0.11%), Immigrants from Bangladesh (3.36, a difference of 0.14%), and Shoshone (3.37, a difference of 0.16%).
| Demographics | Rating | Rank | Average Family Size |
| Immigrants | Vietnam | 100.0 /100 | #42 | Exceptional 3.38 |
| Immigrants | Philippines | 100.0 /100 | #43 | Exceptional 3.37 |
| Alaska Natives | 100.0 /100 | #44 | Exceptional 3.37 |
| Shoshone | 100.0 /100 | #45 | Exceptional 3.37 |
| Haitians | 100.0 /100 | #46 | Exceptional 3.37 |
| Vietnamese | 100.0 /100 | #47 | Exceptional 3.37 |
| Immigrants | Nicaragua | 100.0 /100 | #48 | Exceptional 3.37 |
| Bangladeshis | 100.0 /100 | #49 | Exceptional 3.37 |
| Immigrants | Bangladesh | 100.0 /100 | #50 | Exceptional 3.36 |
| Nicaraguans | 100.0 /100 | #51 | Exceptional 3.36 |
| Fijians | 100.0 /100 | #52 | Exceptional 3.36 |
| Koreans | 100.0 /100 | #53 | Exceptional 3.36 |
| Immigrants | South Eastern Asia | 100.0 /100 | #54 | Exceptional 3.36 |
| Immigrants | Honduras | 100.0 /100 | #55 | Exceptional 3.36 |
| Immigrants | Dominican Republic | 100.0 /100 | #56 | Exceptional 3.35 |