Inupiat vs Immigrants from St. Vincent and the Grenadines Single Father Households
COMPARE
Inupiat
Immigrants from St. Vincent and the Grenadines
Single Father Households
Single Father Households Comparison
Inupiat
Immigrants from St. Vincent and the Grenadines
4.9%
SINGLE FATHER HOUSEHOLDS
0.0/ 100
METRIC RATING
346th/ 347
METRIC RANK
2.0%
SINGLE FATHER HOUSEHOLDS
100.0/ 100
METRIC RATING
37th/ 347
METRIC RANK
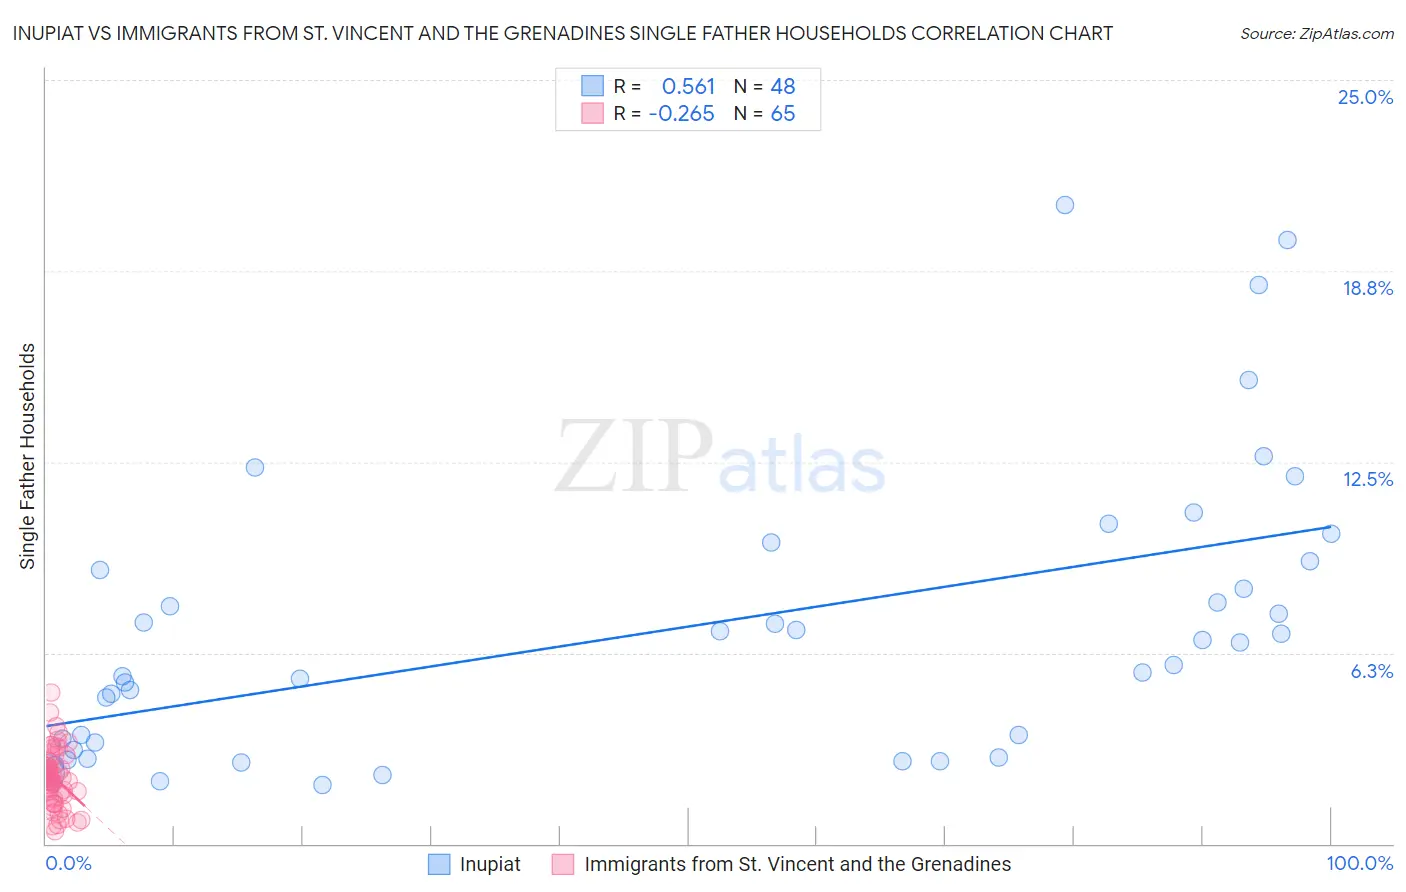
Inupiat vs Immigrants from St. Vincent and the Grenadines Single Father Households Correlation Chart
The statistical analysis conducted on geographies consisting of 96,117,395 people shows a substantial positive correlation between the proportion of Inupiat and percentage of single father households in the United States with a correlation coefficient (R) of 0.561 and weighted average of 4.9%. Similarly, the statistical analysis conducted on geographies consisting of 56,084,027 people shows a weak negative correlation between the proportion of Immigrants from St. Vincent and the Grenadines and percentage of single father households in the United States with a correlation coefficient (R) of -0.265 and weighted average of 2.0%, a difference of 144.8%.
Single Father Households Correlation Summary
| Measurement | Inupiat | Immigrants from St. Vincent and the Grenadines |
| Minimum | 1.9% | 0.40% |
| Maximum | 20.9% | 4.9% |
| Range | 19.0% | 4.5% |
| Mean | 7.0% | 2.2% |
| Median | 6.2% | 2.2% |
| Interquartile 25% (IQ1) | 3.2% | 1.6% |
| Interquartile 75% (IQ3) | 9.1% | 2.5% |
| Interquartile Range (IQR) | 5.9% | 0.98% |
| Standard Deviation (Sample) | 4.6% | 0.92% |
| Standard Deviation (Population) | 4.6% | 0.91% |
Similar Demographics by Single Father Households
Demographics Similar to Inupiat by Single Father Households
In terms of single father households, the demographic groups most similar to Inupiat are Yup'ik (5.4%, a difference of 10.7%), Menominee (4.2%, a difference of 15.3%), Yakama (4.2%, a difference of 16.2%), Pima (4.2%, a difference of 16.4%), and Tohono O'odham (3.8%, a difference of 27.2%).
| Demographics | Rating | Rank | Single Father Households |
| Natives/Alaskans | 0.0 /100 | #333 | Tragic 3.2% |
| Yuman | 0.0 /100 | #334 | Tragic 3.3% |
| Colville | 0.0 /100 | #335 | Tragic 3.3% |
| Paiute | 0.0 /100 | #336 | Tragic 3.3% |
| Pueblo | 0.0 /100 | #337 | Tragic 3.3% |
| Sioux | 0.0 /100 | #338 | Tragic 3.3% |
| Alaskan Athabascans | 0.0 /100 | #339 | Tragic 3.4% |
| Alaska Natives | 0.0 /100 | #340 | Tragic 3.5% |
| Crow | 0.0 /100 | #341 | Tragic 3.5% |
| Tohono O'odham | 0.0 /100 | #342 | Tragic 3.8% |
| Pima | 0.0 /100 | #343 | Tragic 4.2% |
| Yakama | 0.0 /100 | #344 | Tragic 4.2% |
| Menominee | 0.0 /100 | #345 | Tragic 4.2% |
| Inupiat | 0.0 /100 | #346 | Tragic 4.9% |
| Yup'ik | 0.0 /100 | #347 | Tragic 5.4% |
Demographics Similar to Immigrants from St. Vincent and the Grenadines by Single Father Households
In terms of single father households, the demographic groups most similar to Immigrants from St. Vincent and the Grenadines are Immigrants from Belgium (2.0%, a difference of 0.020%), Albanian (2.0%, a difference of 0.13%), Immigrants from Eastern Europe (2.0%, a difference of 0.30%), Immigrants from Sri Lanka (2.0%, a difference of 0.30%), and Immigrants from Bulgaria (2.0%, a difference of 0.35%).
| Demographics | Rating | Rank | Single Father Households |
| Cambodians | 100.0 /100 | #30 | Exceptional 2.0% |
| Israelis | 100.0 /100 | #31 | Exceptional 2.0% |
| Chinese | 100.0 /100 | #32 | Exceptional 2.0% |
| Turks | 100.0 /100 | #33 | Exceptional 2.0% |
| Immigrants | Australia | 100.0 /100 | #34 | Exceptional 2.0% |
| Albanians | 100.0 /100 | #35 | Exceptional 2.0% |
| Immigrants | Belgium | 100.0 /100 | #36 | Exceptional 2.0% |
| Immigrants | St. Vincent and the Grenadines | 100.0 /100 | #37 | Exceptional 2.0% |
| Immigrants | Eastern Europe | 100.0 /100 | #38 | Exceptional 2.0% |
| Immigrants | Sri Lanka | 100.0 /100 | #39 | Exceptional 2.0% |
| Immigrants | Bulgaria | 100.0 /100 | #40 | Exceptional 2.0% |
| Immigrants | Turkey | 100.0 /100 | #41 | Exceptional 2.0% |
| Macedonians | 100.0 /100 | #42 | Exceptional 2.0% |
| Immigrants | Grenada | 100.0 /100 | #43 | Exceptional 2.0% |
| Latvians | 100.0 /100 | #44 | Exceptional 2.0% |