Inupiat vs Senegalese Single Father Households
COMPARE
Inupiat
Senegalese
Single Father Households
Single Father Households Comparison
Inupiat
Senegalese
4.9%
SINGLE FATHER HOUSEHOLDS
0.0/ 100
METRIC RATING
346th/ 347
METRIC RANK
2.3%
SINGLE FATHER HOUSEHOLDS
88.4/ 100
METRIC RATING
149th/ 347
METRIC RANK
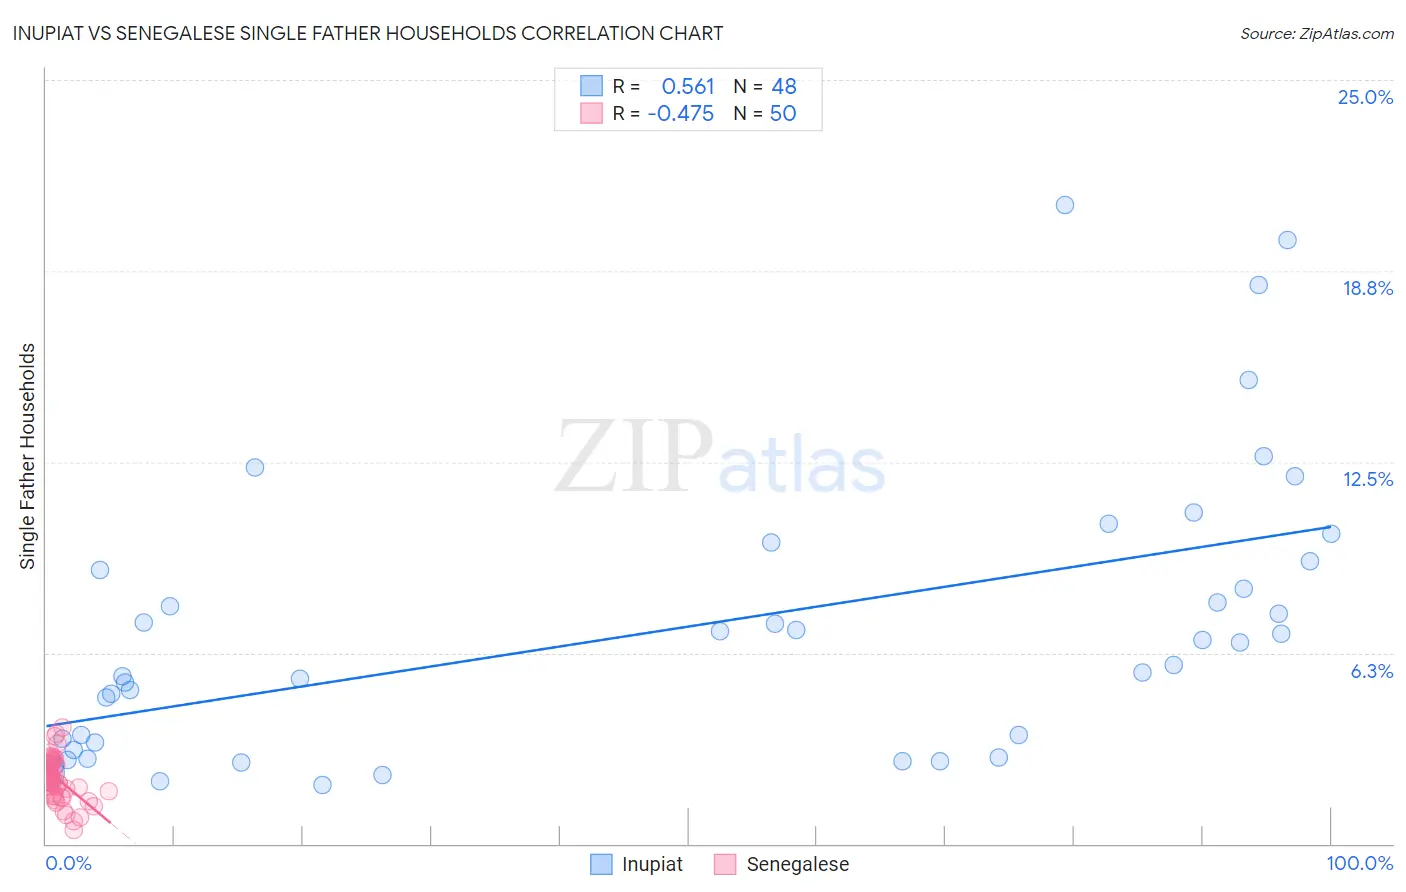
Inupiat vs Senegalese Single Father Households Correlation Chart
The statistical analysis conducted on geographies consisting of 96,117,395 people shows a substantial positive correlation between the proportion of Inupiat and percentage of single father households in the United States with a correlation coefficient (R) of 0.561 and weighted average of 4.9%. Similarly, the statistical analysis conducted on geographies consisting of 77,943,775 people shows a moderate negative correlation between the proportion of Senegalese and percentage of single father households in the United States with a correlation coefficient (R) of -0.475 and weighted average of 2.3%, a difference of 116.0%.
Single Father Households Correlation Summary
| Measurement | Inupiat | Senegalese |
| Minimum | 1.9% | 0.44% |
| Maximum | 20.9% | 3.8% |
| Range | 19.0% | 3.4% |
| Mean | 7.0% | 2.1% |
| Median | 6.2% | 2.1% |
| Interquartile 25% (IQ1) | 3.2% | 1.6% |
| Interquartile 75% (IQ3) | 9.1% | 2.7% |
| Interquartile Range (IQR) | 5.9% | 1.1% |
| Standard Deviation (Sample) | 4.6% | 0.74% |
| Standard Deviation (Population) | 4.6% | 0.73% |
Similar Demographics by Single Father Households
Demographics Similar to Inupiat by Single Father Households
In terms of single father households, the demographic groups most similar to Inupiat are Yup'ik (5.4%, a difference of 10.7%), Menominee (4.2%, a difference of 15.3%), Yakama (4.2%, a difference of 16.2%), Pima (4.2%, a difference of 16.4%), and Tohono O'odham (3.8%, a difference of 27.2%).
| Demographics | Rating | Rank | Single Father Households |
| Natives/Alaskans | 0.0 /100 | #333 | Tragic 3.2% |
| Yuman | 0.0 /100 | #334 | Tragic 3.3% |
| Colville | 0.0 /100 | #335 | Tragic 3.3% |
| Paiute | 0.0 /100 | #336 | Tragic 3.3% |
| Pueblo | 0.0 /100 | #337 | Tragic 3.3% |
| Sioux | 0.0 /100 | #338 | Tragic 3.3% |
| Alaskan Athabascans | 0.0 /100 | #339 | Tragic 3.4% |
| Alaska Natives | 0.0 /100 | #340 | Tragic 3.5% |
| Crow | 0.0 /100 | #341 | Tragic 3.5% |
| Tohono O'odham | 0.0 /100 | #342 | Tragic 3.8% |
| Pima | 0.0 /100 | #343 | Tragic 4.2% |
| Yakama | 0.0 /100 | #344 | Tragic 4.2% |
| Menominee | 0.0 /100 | #345 | Tragic 4.2% |
| Inupiat | 0.0 /100 | #346 | Tragic 4.9% |
| Yup'ik | 0.0 /100 | #347 | Tragic 5.4% |
Demographics Similar to Senegalese by Single Father Households
In terms of single father households, the demographic groups most similar to Senegalese are South American Indian (2.3%, a difference of 0.010%), Slavic (2.2%, a difference of 0.10%), Northern European (2.2%, a difference of 0.28%), Immigrants from Zimbabwe (2.2%, a difference of 0.36%), and Venezuelan (2.3%, a difference of 0.38%).
| Demographics | Rating | Rank | Single Father Households |
| Luxembourgers | 92.3 /100 | #142 | Exceptional 2.2% |
| Immigrants | Nepal | 92.1 /100 | #143 | Exceptional 2.2% |
| Slovaks | 90.7 /100 | #144 | Exceptional 2.2% |
| Immigrants | Zimbabwe | 90.2 /100 | #145 | Exceptional 2.2% |
| Northern Europeans | 89.8 /100 | #146 | Excellent 2.2% |
| Slavs | 88.9 /100 | #147 | Excellent 2.2% |
| South American Indians | 88.5 /100 | #148 | Excellent 2.3% |
| Senegalese | 88.4 /100 | #149 | Excellent 2.3% |
| Venezuelans | 86.2 /100 | #150 | Excellent 2.3% |
| Immigrants | Syria | 84.8 /100 | #151 | Excellent 2.3% |
| Immigrants | Venezuela | 83.2 /100 | #152 | Excellent 2.3% |
| Immigrants | Germany | 82.8 /100 | #153 | Excellent 2.3% |
| Bolivians | 81.0 /100 | #154 | Excellent 2.3% |
| Europeans | 80.9 /100 | #155 | Excellent 2.3% |
| Immigrants | South America | 79.9 /100 | #156 | Good 2.3% |