Inupiat vs Serbian Currently Married
COMPARE
Inupiat
Serbian
Currently Married
Currently Married Comparison
Inupiat
Serbians
41.3%
CURRENTLY MARRIED
0.0/ 100
METRIC RATING
315th/ 347
METRIC RANK
47.8%
CURRENTLY MARRIED
93.6/ 100
METRIC RATING
104th/ 347
METRIC RANK
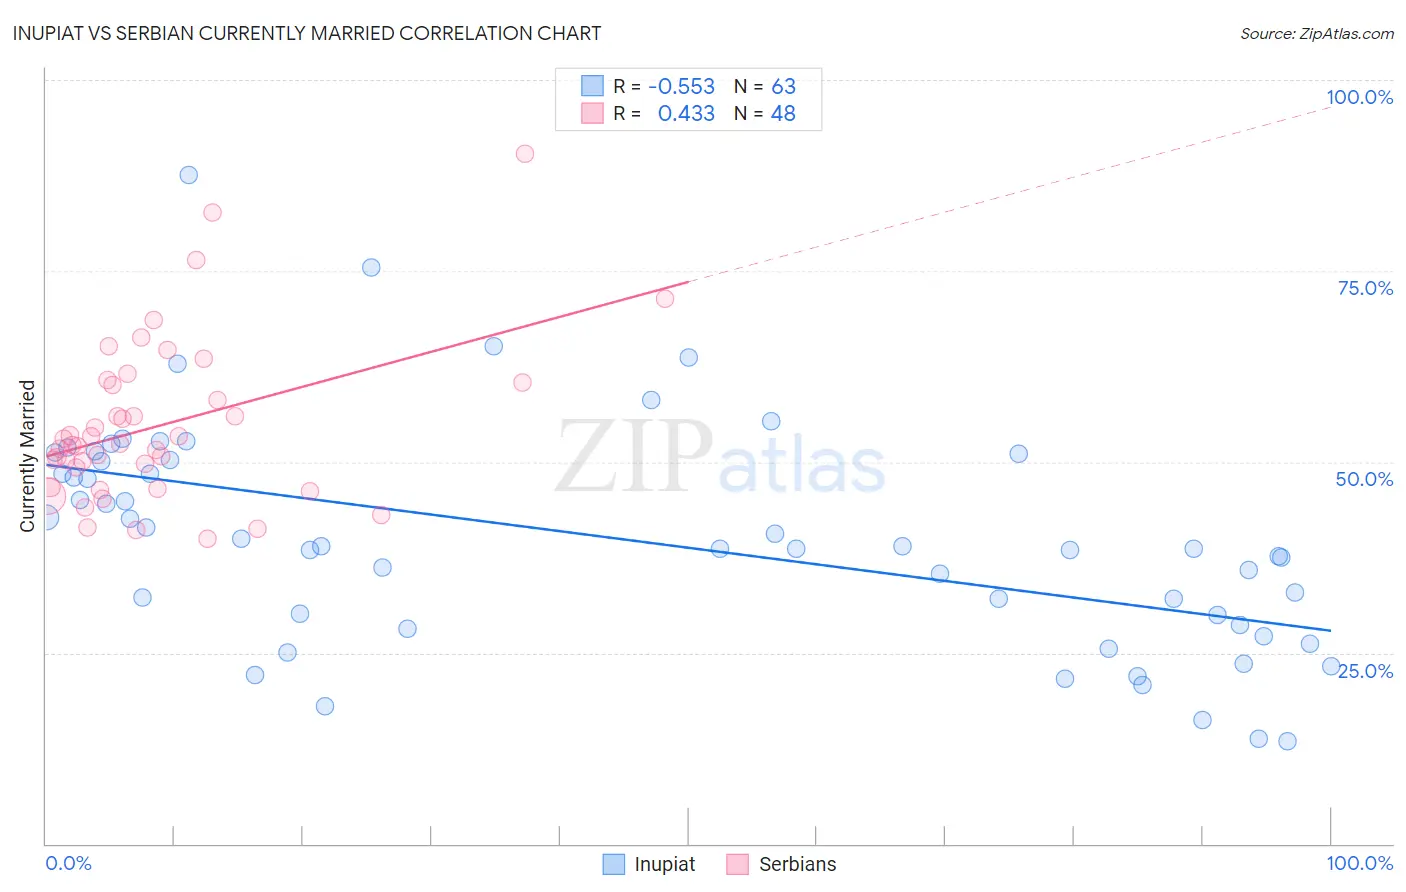
Inupiat vs Serbian Currently Married Correlation Chart
The statistical analysis conducted on geographies consisting of 96,349,193 people shows a substantial negative correlation between the proportion of Inupiat and percentage of population currently married in the United States with a correlation coefficient (R) of -0.553 and weighted average of 41.3%. Similarly, the statistical analysis conducted on geographies consisting of 267,625,038 people shows a moderate positive correlation between the proportion of Serbians and percentage of population currently married in the United States with a correlation coefficient (R) of 0.433 and weighted average of 47.8%, a difference of 15.7%.
Currently Married Correlation Summary
| Measurement | Inupiat | Serbian |
| Minimum | 13.5% | 40.0% |
| Maximum | 87.5% | 90.4% |
| Range | 74.0% | 50.4% |
| Mean | 40.0% | 54.8% |
| Median | 38.7% | 52.3% |
| Interquartile 25% (IQ1) | 28.7% | 47.9% |
| Interquartile 75% (IQ3) | 50.3% | 60.3% |
| Interquartile Range (IQR) | 21.6% | 12.3% |
| Standard Deviation (Sample) | 14.7% | 10.6% |
| Standard Deviation (Population) | 14.6% | 10.4% |
Similar Demographics by Currently Married
Demographics Similar to Inupiat by Currently Married
In terms of currently married, the demographic groups most similar to Inupiat are Immigrants from Caribbean (41.3%, a difference of 0.060%), Haitian (41.3%, a difference of 0.080%), West Indian (41.3%, a difference of 0.090%), Jamaican (41.4%, a difference of 0.16%), and Bahamian (41.2%, a difference of 0.26%).
| Demographics | Rating | Rank | Currently Married |
| Immigrants | Belize | 0.0 /100 | #308 | Tragic 41.8% |
| Immigrants | Liberia | 0.0 /100 | #309 | Tragic 41.8% |
| Guyanese | 0.0 /100 | #310 | Tragic 41.6% |
| Trinidadians and Tobagonians | 0.0 /100 | #311 | Tragic 41.5% |
| Somalis | 0.0 /100 | #312 | Tragic 41.5% |
| Jamaicans | 0.0 /100 | #313 | Tragic 41.4% |
| West Indians | 0.0 /100 | #314 | Tragic 41.3% |
| Inupiat | 0.0 /100 | #315 | Tragic 41.3% |
| Immigrants | Caribbean | 0.0 /100 | #316 | Tragic 41.3% |
| Haitians | 0.0 /100 | #317 | Tragic 41.3% |
| Bahamians | 0.0 /100 | #318 | Tragic 41.2% |
| Immigrants | Somalia | 0.0 /100 | #319 | Tragic 41.2% |
| Immigrants | Jamaica | 0.0 /100 | #320 | Tragic 41.1% |
| Immigrants | Congo | 0.0 /100 | #321 | Tragic 41.1% |
| Immigrants | Haiti | 0.0 /100 | #322 | Tragic 41.0% |
Demographics Similar to Serbians by Currently Married
In terms of currently married, the demographic groups most similar to Serbians are Cypriot (47.8%, a difference of 0.020%), Turkish (47.8%, a difference of 0.050%), Immigrants from Singapore (47.8%, a difference of 0.050%), Immigrants from Germany (47.8%, a difference of 0.070%), and Celtic (47.8%, a difference of 0.080%).
| Demographics | Rating | Rank | Currently Married |
| Immigrants | Ukraine | 94.8 /100 | #97 | Exceptional 47.9% |
| Immigrants | China | 94.7 /100 | #98 | Exceptional 47.9% |
| Immigrants | Sweden | 94.3 /100 | #99 | Exceptional 47.8% |
| Celtics | 94.2 /100 | #100 | Exceptional 47.8% |
| Immigrants | Germany | 94.1 /100 | #101 | Exceptional 47.8% |
| Turks | 93.9 /100 | #102 | Exceptional 47.8% |
| Cypriots | 93.7 /100 | #103 | Exceptional 47.8% |
| Serbians | 93.6 /100 | #104 | Exceptional 47.8% |
| Immigrants | Singapore | 93.3 /100 | #105 | Exceptional 47.8% |
| Immigrants | Greece | 93.1 /100 | #106 | Exceptional 47.7% |
| Immigrants | Italy | 92.9 /100 | #107 | Exceptional 47.7% |
| Tsimshian | 92.4 /100 | #108 | Exceptional 47.7% |
| Immigrants | Egypt | 92.3 /100 | #109 | Exceptional 47.7% |
| Immigrants | Russia | 92.0 /100 | #110 | Exceptional 47.7% |
| Immigrants | Hungary | 91.2 /100 | #111 | Exceptional 47.6% |