Inupiat vs Lebanese Currently Married
COMPARE
Inupiat
Lebanese
Currently Married
Currently Married Comparison
Inupiat
Lebanese
41.3%
CURRENTLY MARRIED
0.0/ 100
METRIC RATING
315th/ 347
METRIC RANK
47.9%
CURRENTLY MARRIED
95.1/ 100
METRIC RATING
93rd/ 347
METRIC RANK
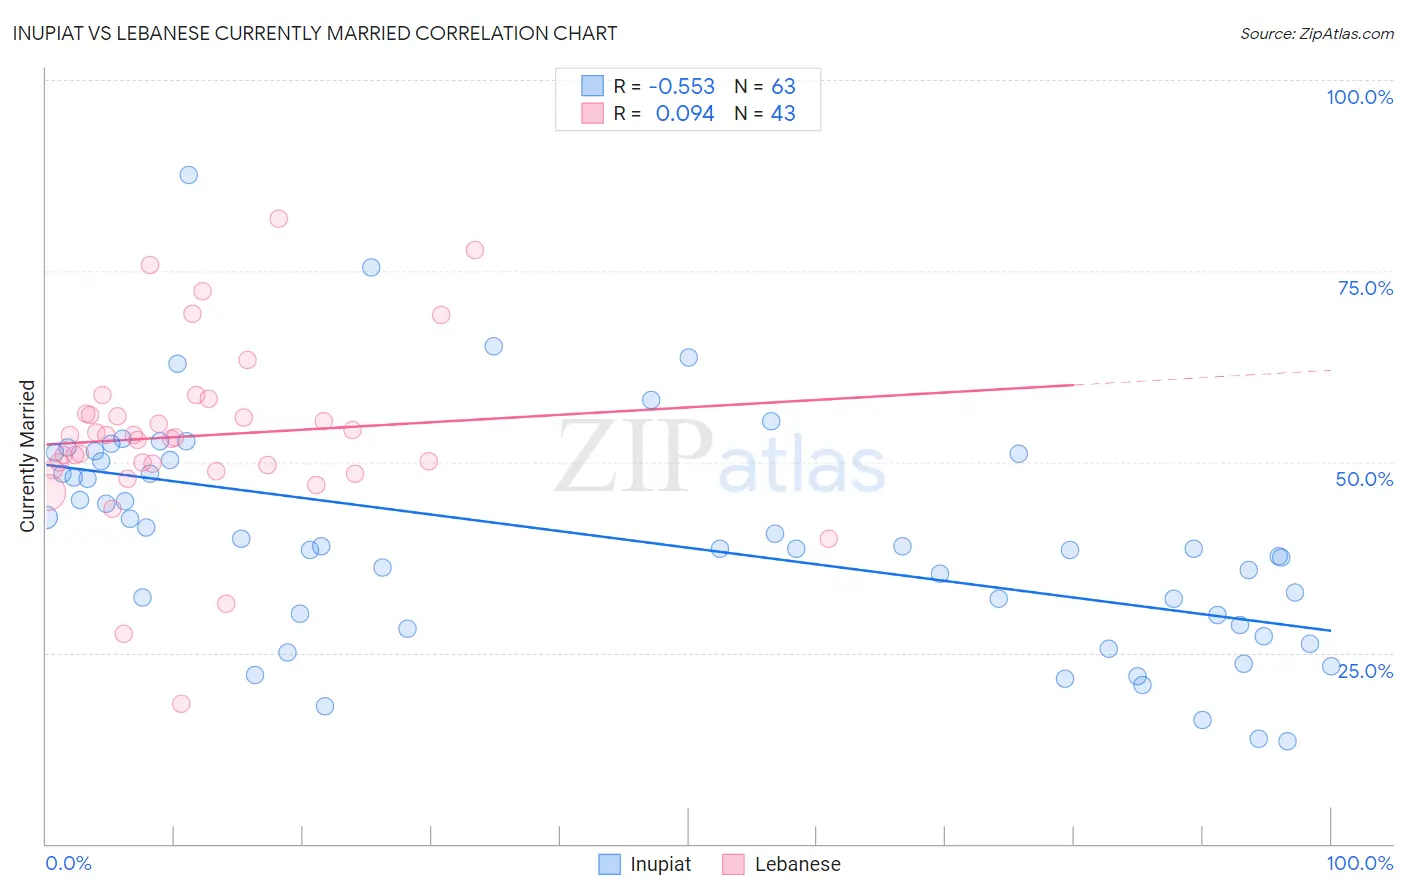
Inupiat vs Lebanese Currently Married Correlation Chart
The statistical analysis conducted on geographies consisting of 96,349,193 people shows a substantial negative correlation between the proportion of Inupiat and percentage of population currently married in the United States with a correlation coefficient (R) of -0.553 and weighted average of 41.3%. Similarly, the statistical analysis conducted on geographies consisting of 401,555,158 people shows a slight positive correlation between the proportion of Lebanese and percentage of population currently married in the United States with a correlation coefficient (R) of 0.094 and weighted average of 47.9%, a difference of 16.0%.
Currently Married Correlation Summary
| Measurement | Inupiat | Lebanese |
| Minimum | 13.5% | 18.3% |
| Maximum | 87.5% | 81.9% |
| Range | 74.0% | 63.6% |
| Mean | 40.0% | 53.4% |
| Median | 38.7% | 53.2% |
| Interquartile 25% (IQ1) | 28.7% | 49.1% |
| Interquartile 75% (IQ3) | 50.3% | 56.3% |
| Interquartile Range (IQR) | 21.6% | 7.3% |
| Standard Deviation (Sample) | 14.7% | 11.9% |
| Standard Deviation (Population) | 14.6% | 11.7% |
Similar Demographics by Currently Married
Demographics Similar to Inupiat by Currently Married
In terms of currently married, the demographic groups most similar to Inupiat are Immigrants from Caribbean (41.3%, a difference of 0.060%), Haitian (41.3%, a difference of 0.080%), West Indian (41.3%, a difference of 0.090%), Jamaican (41.4%, a difference of 0.16%), and Bahamian (41.2%, a difference of 0.26%).
| Demographics | Rating | Rank | Currently Married |
| Immigrants | Belize | 0.0 /100 | #308 | Tragic 41.8% |
| Immigrants | Liberia | 0.0 /100 | #309 | Tragic 41.8% |
| Guyanese | 0.0 /100 | #310 | Tragic 41.6% |
| Trinidadians and Tobagonians | 0.0 /100 | #311 | Tragic 41.5% |
| Somalis | 0.0 /100 | #312 | Tragic 41.5% |
| Jamaicans | 0.0 /100 | #313 | Tragic 41.4% |
| West Indians | 0.0 /100 | #314 | Tragic 41.3% |
| Inupiat | 0.0 /100 | #315 | Tragic 41.3% |
| Immigrants | Caribbean | 0.0 /100 | #316 | Tragic 41.3% |
| Haitians | 0.0 /100 | #317 | Tragic 41.3% |
| Bahamians | 0.0 /100 | #318 | Tragic 41.2% |
| Immigrants | Somalia | 0.0 /100 | #319 | Tragic 41.2% |
| Immigrants | Jamaica | 0.0 /100 | #320 | Tragic 41.1% |
| Immigrants | Congo | 0.0 /100 | #321 | Tragic 41.1% |
| Immigrants | Haiti | 0.0 /100 | #322 | Tragic 41.0% |
Demographics Similar to Lebanese by Currently Married
In terms of currently married, the demographic groups most similar to Lebanese are Native Hawaiian (47.9%, a difference of 0.010%), Korean (47.9%, a difference of 0.050%), Immigrants from Bulgaria (47.9%, a difference of 0.050%), Egyptian (47.9%, a difference of 0.050%), and Immigrants from Ukraine (47.9%, a difference of 0.060%).
| Demographics | Rating | Rank | Currently Married |
| Immigrants | Japan | 96.2 /100 | #86 | Exceptional 48.0% |
| Jordanians | 96.2 /100 | #87 | Exceptional 48.0% |
| Immigrants | Eastern Europe | 96.1 /100 | #88 | Exceptional 48.0% |
| Indians (Asian) | 95.8 /100 | #89 | Exceptional 48.0% |
| Americans | 95.7 /100 | #90 | Exceptional 48.0% |
| Immigrants | Bolivia | 95.6 /100 | #91 | Exceptional 47.9% |
| Koreans | 95.4 /100 | #92 | Exceptional 47.9% |
| Lebanese | 95.1 /100 | #93 | Exceptional 47.9% |
| Native Hawaiians | 95.0 /100 | #94 | Exceptional 47.9% |
| Immigrants | Bulgaria | 94.8 /100 | #95 | Exceptional 47.9% |
| Egyptians | 94.8 /100 | #96 | Exceptional 47.9% |
| Immigrants | Ukraine | 94.8 /100 | #97 | Exceptional 47.9% |
| Immigrants | China | 94.7 /100 | #98 | Exceptional 47.9% |
| Immigrants | Sweden | 94.3 /100 | #99 | Exceptional 47.8% |
| Celtics | 94.2 /100 | #100 | Exceptional 47.8% |