Slovene vs Immigrants from Romania Average Family Size
COMPARE
Slovene
Immigrants from Romania
Average Family Size
Average Family Size Comparison
Slovenes
Immigrants from Romania
3.07
AVERAGE FAMILY SIZE
0.0/ 100
METRIC RATING
345th/ 347
METRIC RANK
3.18
AVERAGE FAMILY SIZE
3.7/ 100
METRIC RATING
237th/ 347
METRIC RANK
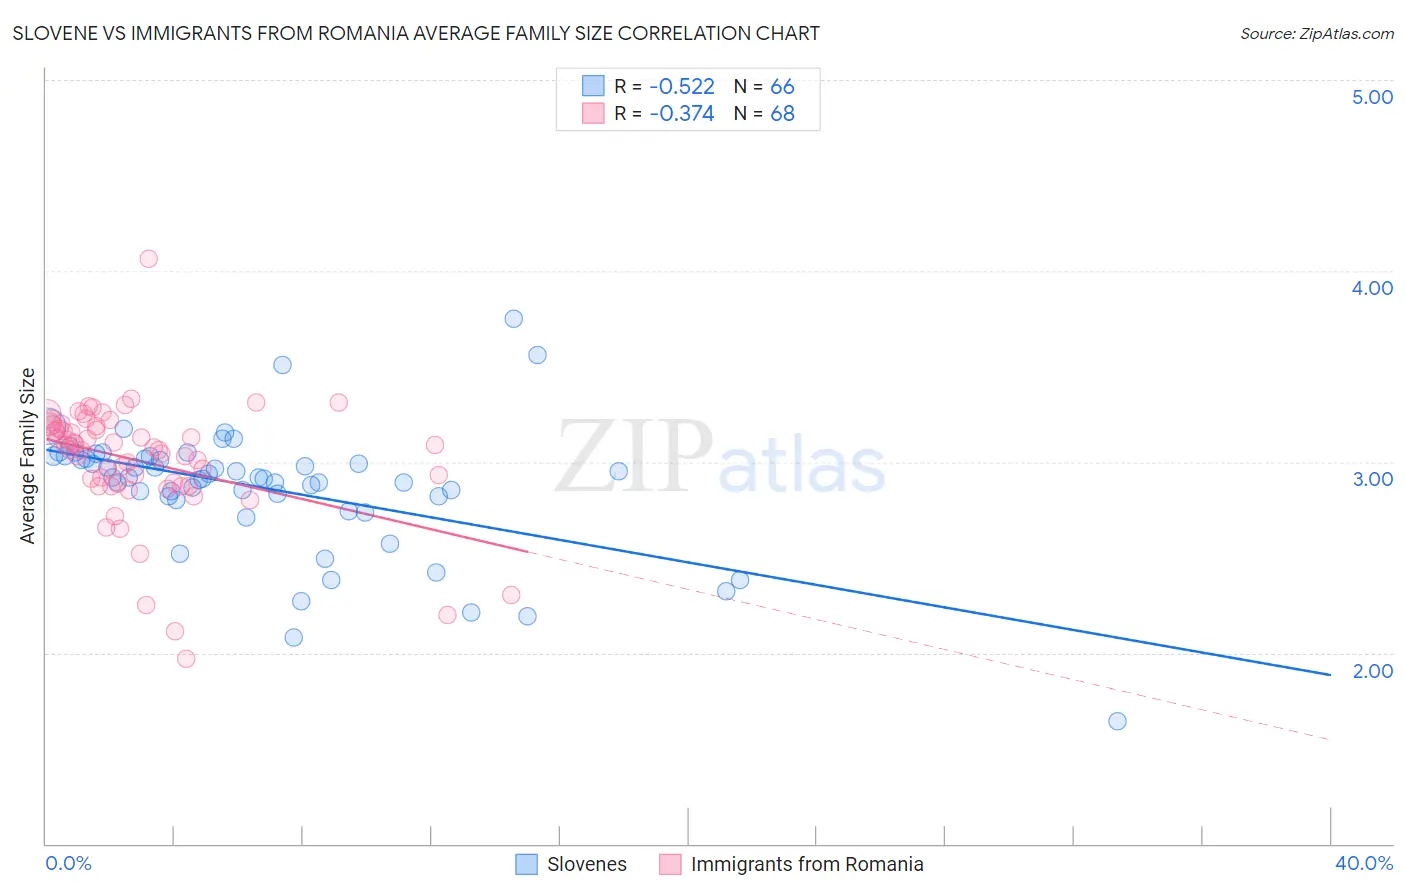
Slovene vs Immigrants from Romania Average Family Size Correlation Chart
The statistical analysis conducted on geographies consisting of 261,257,003 people shows a substantial negative correlation between the proportion of Slovenes and average family size in the United States with a correlation coefficient (R) of -0.522 and weighted average of 3.07. Similarly, the statistical analysis conducted on geographies consisting of 256,963,542 people shows a mild negative correlation between the proportion of Immigrants from Romania and average family size in the United States with a correlation coefficient (R) of -0.374 and weighted average of 3.18, a difference of 3.5%.
Average Family Size Correlation Summary
| Measurement | Slovene | Immigrants from Romania |
| Minimum | 1.64 | 1.97 |
| Maximum | 3.75 | 4.06 |
| Range | 2.11 | 2.09 |
| Mean | 2.86 | 3.00 |
| Median | 2.92 | 3.07 |
| Interquartile 25% (IQ1) | 2.82 | 2.88 |
| Interquartile 75% (IQ3) | 3.03 | 3.19 |
| Interquartile Range (IQR) | 0.21 | 0.31 |
| Standard Deviation (Sample) | 0.34 | 0.32 |
| Standard Deviation (Population) | 0.33 | 0.32 |
Similar Demographics by Average Family Size
Demographics Similar to Slovenes by Average Family Size
In terms of average family size, the demographic groups most similar to Slovenes are French Canadian (3.07, a difference of 0.040%), Norwegian (3.08, a difference of 0.28%), Slovak (3.06, a difference of 0.29%), Carpatho Rusyn (3.06, a difference of 0.35%), and German (3.09, a difference of 0.51%).
| Demographics | Rating | Rank | Average Family Size |
| Estonians | 0.0 /100 | #333 | Tragic 3.10 |
| Lithuanians | 0.0 /100 | #334 | Tragic 3.10 |
| Luxembourgers | 0.0 /100 | #335 | Tragic 3.10 |
| Irish | 0.0 /100 | #336 | Tragic 3.10 |
| Swedes | 0.0 /100 | #337 | Tragic 3.10 |
| French | 0.0 /100 | #338 | Tragic 3.10 |
| Croatians | 0.0 /100 | #339 | Tragic 3.10 |
| Finns | 0.0 /100 | #340 | Tragic 3.09 |
| Poles | 0.0 /100 | #341 | Tragic 3.09 |
| Germans | 0.0 /100 | #342 | Tragic 3.09 |
| Norwegians | 0.0 /100 | #343 | Tragic 3.08 |
| French Canadians | 0.0 /100 | #344 | Tragic 3.07 |
| Slovenes | 0.0 /100 | #345 | Tragic 3.07 |
| Slovaks | 0.0 /100 | #346 | Tragic 3.06 |
| Carpatho Rusyns | 0.0 /100 | #347 | Tragic 3.06 |
Demographics Similar to Immigrants from Romania by Average Family Size
In terms of average family size, the demographic groups most similar to Immigrants from Romania are Romanian (3.18, a difference of 0.0%), Immigrants from Portugal (3.18, a difference of 0.050%), Houma (3.18, a difference of 0.050%), Immigrants from Turkey (3.18, a difference of 0.060%), and Osage (3.18, a difference of 0.070%).
| Demographics | Rating | Rank | Average Family Size |
| Icelanders | 5.2 /100 | #230 | Tragic 3.19 |
| Basques | 5.2 /100 | #231 | Tragic 3.19 |
| Cherokee | 4.7 /100 | #232 | Tragic 3.18 |
| Brazilians | 4.5 /100 | #233 | Tragic 3.18 |
| Iranians | 4.5 /100 | #234 | Tragic 3.18 |
| Immigrants | Turkey | 4.2 /100 | #235 | Tragic 3.18 |
| Immigrants | Portugal | 4.2 /100 | #236 | Tragic 3.18 |
| Immigrants | Romania | 3.7 /100 | #237 | Tragic 3.18 |
| Romanians | 3.7 /100 | #238 | Tragic 3.18 |
| Houma | 3.4 /100 | #239 | Tragic 3.18 |
| Osage | 3.2 /100 | #240 | Tragic 3.18 |
| Immigrants | Japan | 3.0 /100 | #241 | Tragic 3.18 |
| Hungarians | 3.0 /100 | #242 | Tragic 3.18 |
| Immigrants | Moldova | 2.9 /100 | #243 | Tragic 3.18 |
| Immigrants | Southern Europe | 2.9 /100 | #244 | Tragic 3.18 |