Indian (Asian) vs Immigrants from Guyana Family Households
COMPARE
Indian (Asian)
Immigrants from Guyana
Family Households
Family Households Comparison
Indians (Asian)
Immigrants from Guyana
65.1%
FAMILY HOUSEHOLDS
97.9/ 100
METRIC RATING
103rd/ 347
METRIC RANK
65.5%
FAMILY HOUSEHOLDS
99.6/ 100
METRIC RATING
83rd/ 347
METRIC RANK
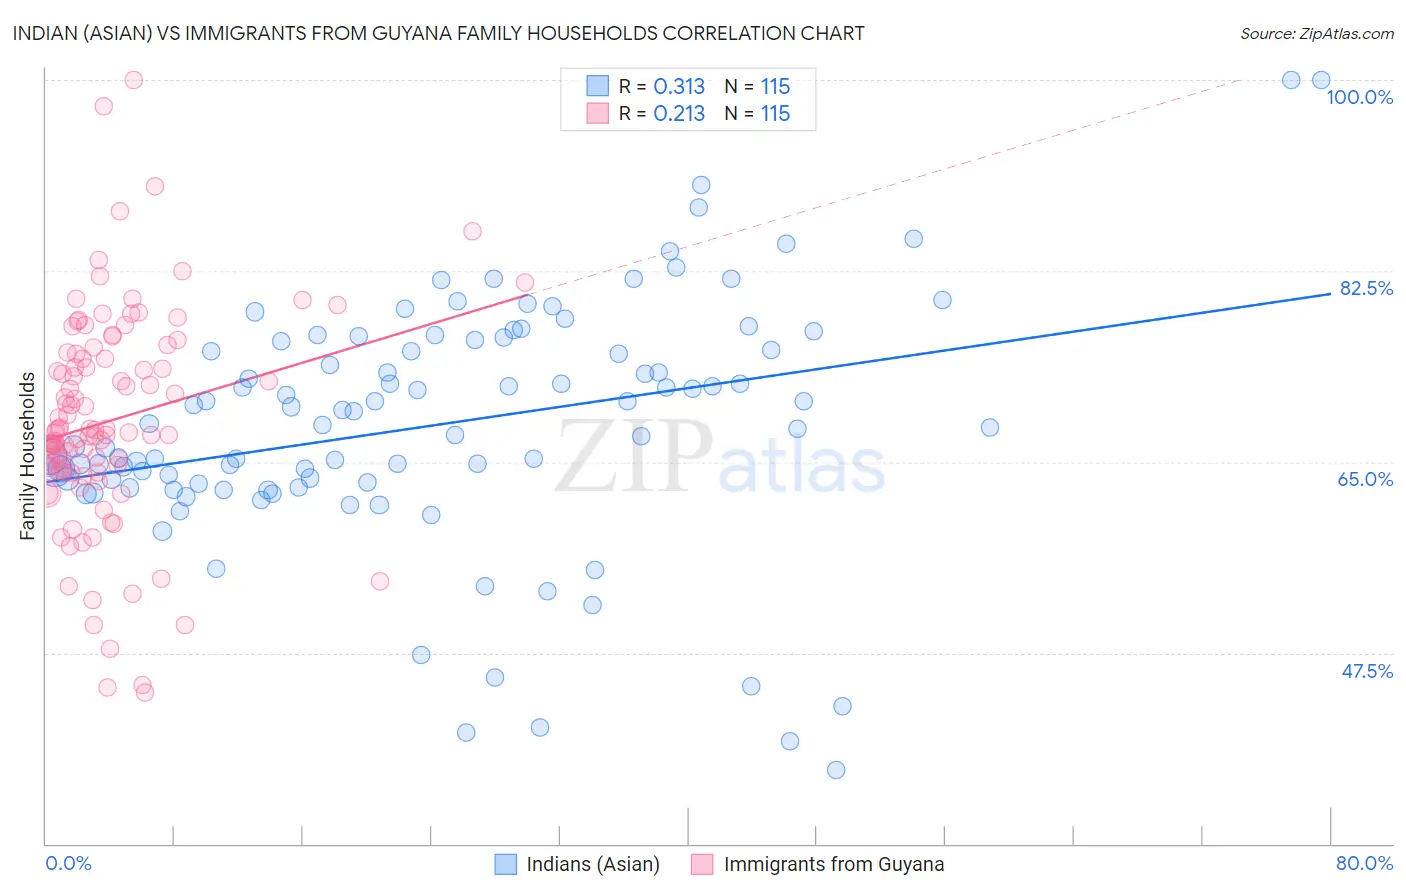
Indian (Asian) vs Immigrants from Guyana Family Households Correlation Chart
The statistical analysis conducted on geographies consisting of 494,783,710 people shows a mild positive correlation between the proportion of Indians (Asian) and percentage of family households in the United States with a correlation coefficient (R) of 0.313 and weighted average of 65.1%. Similarly, the statistical analysis conducted on geographies consisting of 183,692,890 people shows a weak positive correlation between the proportion of Immigrants from Guyana and percentage of family households in the United States with a correlation coefficient (R) of 0.213 and weighted average of 65.5%, a difference of 0.60%.
Family Households Correlation Summary
| Measurement | Indian (Asian) | Immigrants from Guyana |
| Minimum | 36.8% | 43.8% |
| Maximum | 100.0% | 100.0% |
| Range | 63.2% | 56.2% |
| Mean | 68.4% | 68.8% |
| Median | 68.4% | 67.6% |
| Interquartile 25% (IQ1) | 63.0% | 64.1% |
| Interquartile 75% (IQ3) | 76.1% | 74.9% |
| Interquartile Range (IQR) | 13.1% | 10.8% |
| Standard Deviation (Sample) | 11.2% | 9.8% |
| Standard Deviation (Population) | 11.2% | 9.8% |
Demographics Similar to Indians (Asian) and Immigrants from Guyana by Family Households
In terms of family households, the demographic groups most similar to Indians (Asian) are Immigrants from Sri Lanka (65.1%, a difference of 0.020%), Haitian (65.2%, a difference of 0.040%), Chilean (65.2%, a difference of 0.040%), Central American Indian (65.2%, a difference of 0.080%), and Immigrants from Syria (65.2%, a difference of 0.090%). Similarly, the demographic groups most similar to Immigrants from Guyana are American (65.5%, a difference of 0.020%), Immigrants from Cambodia (65.4%, a difference of 0.13%), Egyptian (65.4%, a difference of 0.18%), Immigrants from Egypt (65.3%, a difference of 0.27%), and Immigrants from Haiti (65.3%, a difference of 0.29%).
| Demographics | Rating | Rank | Family Households |
| Immigrants | Guyana | 99.6 /100 | #83 | Exceptional 65.5% |
| Americans | 99.6 /100 | #84 | Exceptional 65.5% |
| Immigrants | Cambodia | 99.5 /100 | #85 | Exceptional 65.4% |
| Egyptians | 99.4 /100 | #86 | Exceptional 65.4% |
| Immigrants | Egypt | 99.2 /100 | #87 | Exceptional 65.3% |
| Immigrants | Haiti | 99.1 /100 | #88 | Exceptional 65.3% |
| Immigrants | Caribbean | 99.1 /100 | #89 | Exceptional 65.3% |
| Immigrants | Laos | 99.1 /100 | #90 | Exceptional 65.3% |
| Crow | 98.9 /100 | #91 | Exceptional 65.3% |
| Hopi | 98.8 /100 | #92 | Exceptional 65.3% |
| Guyanese | 98.8 /100 | #93 | Exceptional 65.3% |
| Immigrants | Poland | 98.7 /100 | #94 | Exceptional 65.2% |
| Immigrants | Portugal | 98.6 /100 | #95 | Exceptional 65.2% |
| Swiss | 98.6 /100 | #96 | Exceptional 65.2% |
| Guatemalans | 98.6 /100 | #97 | Exceptional 65.2% |
| Immigrants | Syria | 98.4 /100 | #98 | Exceptional 65.2% |
| Central American Indians | 98.3 /100 | #99 | Exceptional 65.2% |
| Haitians | 98.1 /100 | #100 | Exceptional 65.2% |
| Chileans | 98.1 /100 | #101 | Exceptional 65.2% |
| Immigrants | Sri Lanka | 98.0 /100 | #102 | Exceptional 65.1% |
| Indians (Asian) | 97.9 /100 | #103 | Exceptional 65.1% |