Indian (Asian) vs Immigrants from Turkey Family Households
COMPARE
Indian (Asian)
Immigrants from Turkey
Family Households
Family Households Comparison
Indians (Asian)
Immigrants from Turkey
65.1%
FAMILY HOUSEHOLDS
97.9/ 100
METRIC RATING
103rd/ 347
METRIC RANK
63.1%
FAMILY HOUSEHOLDS
0.3/ 100
METRIC RATING
272nd/ 347
METRIC RANK
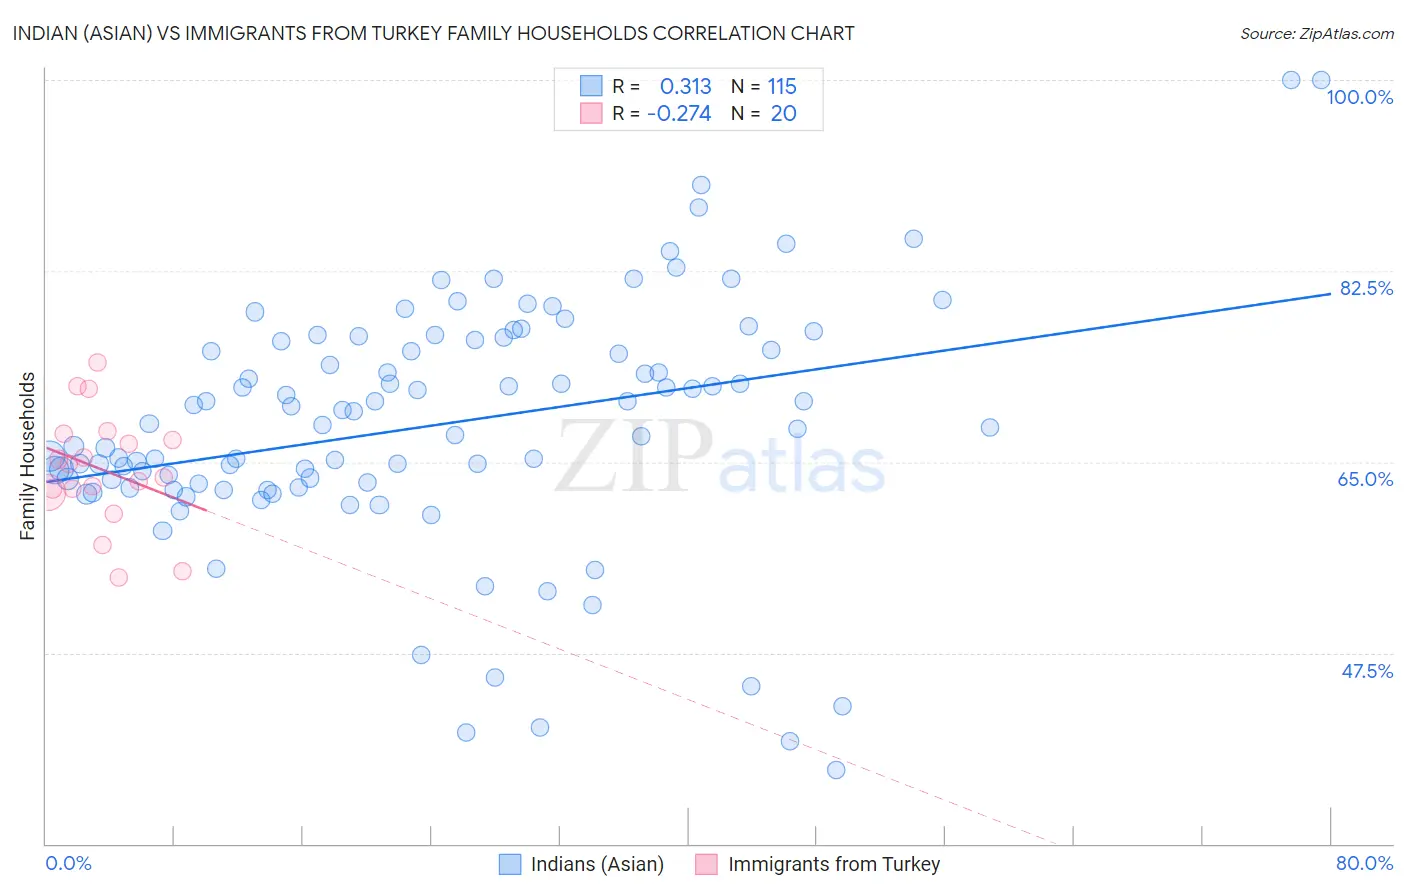
Indian (Asian) vs Immigrants from Turkey Family Households Correlation Chart
The statistical analysis conducted on geographies consisting of 494,783,710 people shows a mild positive correlation between the proportion of Indians (Asian) and percentage of family households in the United States with a correlation coefficient (R) of 0.313 and weighted average of 65.1%. Similarly, the statistical analysis conducted on geographies consisting of 222,976,596 people shows a weak negative correlation between the proportion of Immigrants from Turkey and percentage of family households in the United States with a correlation coefficient (R) of -0.274 and weighted average of 63.1%, a difference of 3.3%.
Family Households Correlation Summary
| Measurement | Indian (Asian) | Immigrants from Turkey |
| Minimum | 36.8% | 54.4% |
| Maximum | 100.0% | 74.1% |
| Range | 63.2% | 19.7% |
| Mean | 68.4% | 64.3% |
| Median | 68.4% | 64.2% |
| Interquartile 25% (IQ1) | 63.0% | 62.4% |
| Interquartile 75% (IQ3) | 76.1% | 67.3% |
| Interquartile Range (IQR) | 13.1% | 4.9% |
| Standard Deviation (Sample) | 11.2% | 5.2% |
| Standard Deviation (Population) | 11.2% | 5.1% |
Similar Demographics by Family Households
Demographics Similar to Indians (Asian) by Family Households
In terms of family households, the demographic groups most similar to Indians (Asian) are Spaniard (65.1%, a difference of 0.010%), Immigrants from Sri Lanka (65.1%, a difference of 0.020%), Haitian (65.2%, a difference of 0.040%), Chilean (65.2%, a difference of 0.040%), and English (65.1%, a difference of 0.070%).
| Demographics | Rating | Rank | Family Households |
| Swiss | 98.6 /100 | #96 | Exceptional 65.2% |
| Guatemalans | 98.6 /100 | #97 | Exceptional 65.2% |
| Immigrants | Syria | 98.4 /100 | #98 | Exceptional 65.2% |
| Central American Indians | 98.3 /100 | #99 | Exceptional 65.2% |
| Haitians | 98.1 /100 | #100 | Exceptional 65.2% |
| Chileans | 98.1 /100 | #101 | Exceptional 65.2% |
| Immigrants | Sri Lanka | 98.0 /100 | #102 | Exceptional 65.1% |
| Indians (Asian) | 97.9 /100 | #103 | Exceptional 65.1% |
| Spaniards | 97.8 /100 | #104 | Exceptional 65.1% |
| English | 97.4 /100 | #105 | Exceptional 65.1% |
| Whites/Caucasians | 97.3 /100 | #106 | Exceptional 65.1% |
| Alaska Natives | 97.3 /100 | #107 | Exceptional 65.1% |
| Palestinians | 97.2 /100 | #108 | Exceptional 65.1% |
| Immigrants | Guatemala | 96.9 /100 | #109 | Exceptional 65.0% |
| Scandinavians | 96.8 /100 | #110 | Exceptional 65.0% |
Demographics Similar to Immigrants from Turkey by Family Households
In terms of family households, the demographic groups most similar to Immigrants from Turkey are Immigrants from Croatia (63.1%, a difference of 0.0%), Immigrants from Austria (63.1%, a difference of 0.010%), Immigrants from Kazakhstan (63.1%, a difference of 0.010%), Lumbee (63.1%, a difference of 0.020%), and West Indian (63.1%, a difference of 0.020%).
| Demographics | Rating | Rank | Family Households |
| Colville | 0.5 /100 | #265 | Tragic 63.2% |
| Immigrants | Western Africa | 0.5 /100 | #266 | Tragic 63.1% |
| Israelis | 0.4 /100 | #267 | Tragic 63.1% |
| Immigrants | Singapore | 0.4 /100 | #268 | Tragic 63.1% |
| Yugoslavians | 0.4 /100 | #269 | Tragic 63.1% |
| Immigrants | Austria | 0.3 /100 | #270 | Tragic 63.1% |
| Immigrants | Croatia | 0.3 /100 | #271 | Tragic 63.1% |
| Immigrants | Turkey | 0.3 /100 | #272 | Tragic 63.1% |
| Immigrants | Kazakhstan | 0.3 /100 | #273 | Tragic 63.1% |
| Lumbee | 0.3 /100 | #274 | Tragic 63.1% |
| West Indians | 0.3 /100 | #275 | Tragic 63.1% |
| Serbians | 0.3 /100 | #276 | Tragic 63.0% |
| Ottawa | 0.3 /100 | #277 | Tragic 63.0% |
| Immigrants | Belgium | 0.2 /100 | #278 | Tragic 63.0% |
| Immigrants | Yemen | 0.2 /100 | #279 | Tragic 63.0% |