Indian (Asian) vs Soviet Union Family Households
COMPARE
Indian (Asian)
Soviet Union
Family Households
Family Households Comparison
Indians (Asian)
Soviet Union
65.1%
FAMILY HOUSEHOLDS
97.9/ 100
METRIC RATING
103rd/ 347
METRIC RANK
60.9%
FAMILY HOUSEHOLDS
0.0/ 100
METRIC RATING
337th/ 347
METRIC RANK
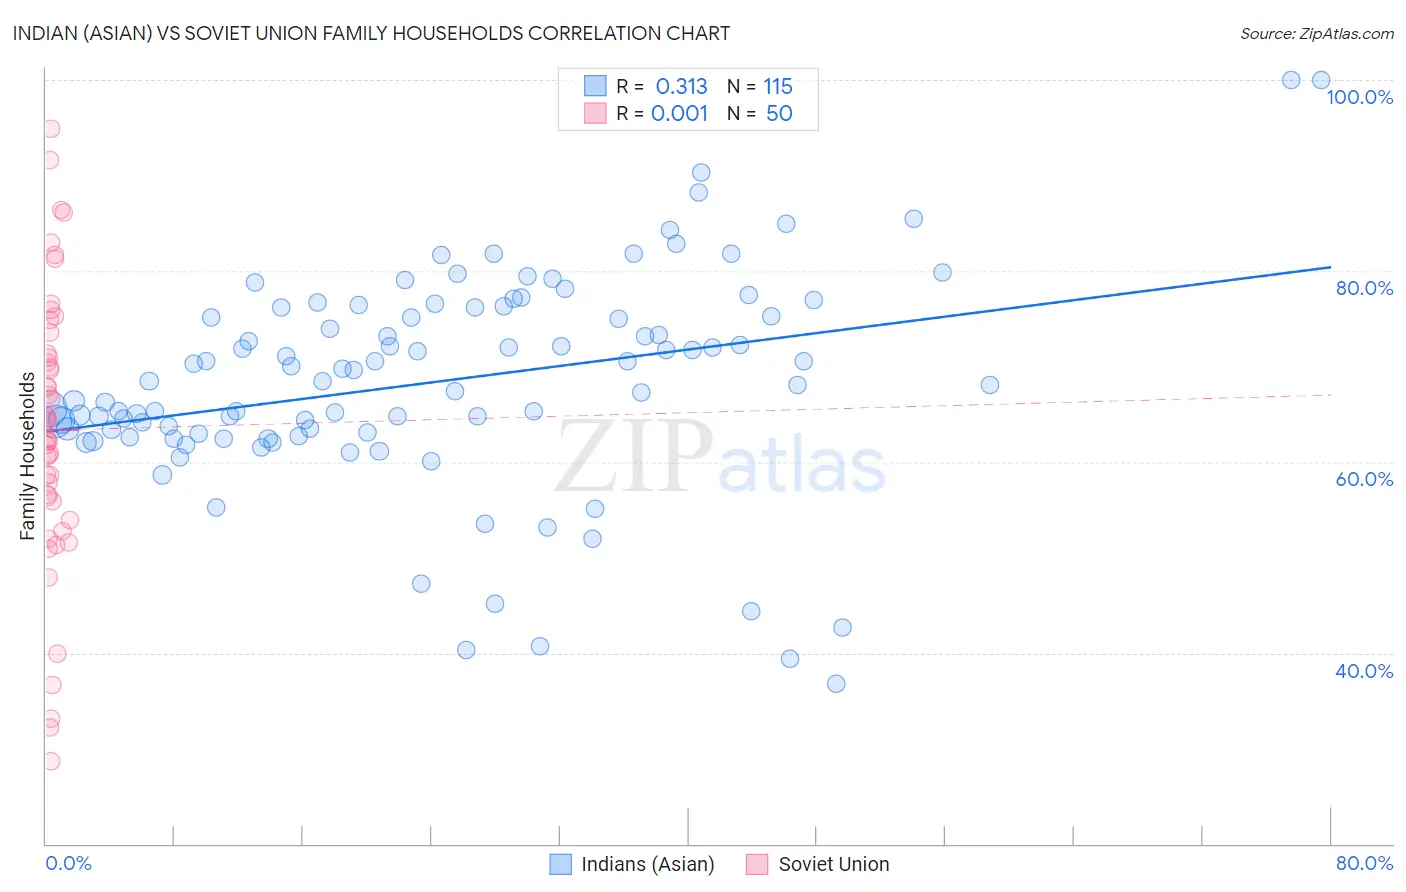
Indian (Asian) vs Soviet Union Family Households Correlation Chart
The statistical analysis conducted on geographies consisting of 494,783,710 people shows a mild positive correlation between the proportion of Indians (Asian) and percentage of family households in the United States with a correlation coefficient (R) of 0.313 and weighted average of 65.1%. Similarly, the statistical analysis conducted on geographies consisting of 43,509,630 people shows no correlation between the proportion of Soviet Union and percentage of family households in the United States with a correlation coefficient (R) of 0.001 and weighted average of 60.9%, a difference of 6.9%.
Family Households Correlation Summary
| Measurement | Indian (Asian) | Soviet Union |
| Minimum | 36.8% | 28.6% |
| Maximum | 100.0% | 94.9% |
| Range | 63.2% | 66.3% |
| Mean | 68.4% | 63.3% |
| Median | 68.4% | 63.3% |
| Interquartile 25% (IQ1) | 63.0% | 55.8% |
| Interquartile 75% (IQ3) | 76.1% | 71.4% |
| Interquartile Range (IQR) | 13.1% | 15.5% |
| Standard Deviation (Sample) | 11.2% | 14.7% |
| Standard Deviation (Population) | 11.2% | 14.5% |
Similar Demographics by Family Households
Demographics Similar to Indians (Asian) by Family Households
In terms of family households, the demographic groups most similar to Indians (Asian) are Spaniard (65.1%, a difference of 0.010%), Immigrants from Sri Lanka (65.1%, a difference of 0.020%), Haitian (65.2%, a difference of 0.040%), Chilean (65.2%, a difference of 0.040%), and English (65.1%, a difference of 0.070%).
| Demographics | Rating | Rank | Family Households |
| Swiss | 98.6 /100 | #96 | Exceptional 65.2% |
| Guatemalans | 98.6 /100 | #97 | Exceptional 65.2% |
| Immigrants | Syria | 98.4 /100 | #98 | Exceptional 65.2% |
| Central American Indians | 98.3 /100 | #99 | Exceptional 65.2% |
| Haitians | 98.1 /100 | #100 | Exceptional 65.2% |
| Chileans | 98.1 /100 | #101 | Exceptional 65.2% |
| Immigrants | Sri Lanka | 98.0 /100 | #102 | Exceptional 65.1% |
| Indians (Asian) | 97.9 /100 | #103 | Exceptional 65.1% |
| Spaniards | 97.8 /100 | #104 | Exceptional 65.1% |
| English | 97.4 /100 | #105 | Exceptional 65.1% |
| Whites/Caucasians | 97.3 /100 | #106 | Exceptional 65.1% |
| Alaska Natives | 97.3 /100 | #107 | Exceptional 65.1% |
| Palestinians | 97.2 /100 | #108 | Exceptional 65.1% |
| Immigrants | Guatemala | 96.9 /100 | #109 | Exceptional 65.0% |
| Scandinavians | 96.8 /100 | #110 | Exceptional 65.0% |
Demographics Similar to Soviet Union by Family Households
In terms of family households, the demographic groups most similar to Soviet Union are German Russian (60.9%, a difference of 0.0%), Immigrants from Eritrea (60.8%, a difference of 0.14%), Carpatho Rusyn (61.1%, a difference of 0.28%), Immigrants from Saudi Arabia (60.7%, a difference of 0.34%), and Immigrants from Eastern Africa (61.1%, a difference of 0.40%).
| Demographics | Rating | Rank | Family Households |
| Immigrants | Australia | 0.0 /100 | #330 | Tragic 61.3% |
| Immigrants | France | 0.0 /100 | #331 | Tragic 61.3% |
| Ethiopians | 0.0 /100 | #332 | Tragic 61.2% |
| Immigrants | Ethiopia | 0.0 /100 | #333 | Tragic 61.2% |
| Immigrants | Eastern Africa | 0.0 /100 | #334 | Tragic 61.1% |
| Carpatho Rusyns | 0.0 /100 | #335 | Tragic 61.1% |
| German Russians | 0.0 /100 | #336 | Tragic 60.9% |
| Soviet Union | 0.0 /100 | #337 | Tragic 60.9% |
| Immigrants | Eritrea | 0.0 /100 | #338 | Tragic 60.8% |
| Immigrants | Saudi Arabia | 0.0 /100 | #339 | Tragic 60.7% |
| Immigrants | Sudan | 0.0 /100 | #340 | Tragic 60.2% |
| Immigrants | Senegal | 0.0 /100 | #341 | Tragic 60.1% |
| Sudanese | 0.0 /100 | #342 | Tragic 60.0% |
| Senegalese | 0.0 /100 | #343 | Tragic 59.8% |
| Immigrants | Congo | 0.0 /100 | #344 | Tragic 59.2% |