Indian (Asian) vs Immigrants from Guyana Single Father Poverty
COMPARE
Indian (Asian)
Immigrants from Guyana
Single Father Poverty
Single Father Poverty Comparison
Indians (Asian)
Immigrants from Guyana
14.8%
SINGLE FATHER POVERTY
100.0/ 100
METRIC RATING
41st/ 347
METRIC RANK
16.5%
SINGLE FATHER POVERTY
27.1/ 100
METRIC RATING
191st/ 347
METRIC RANK
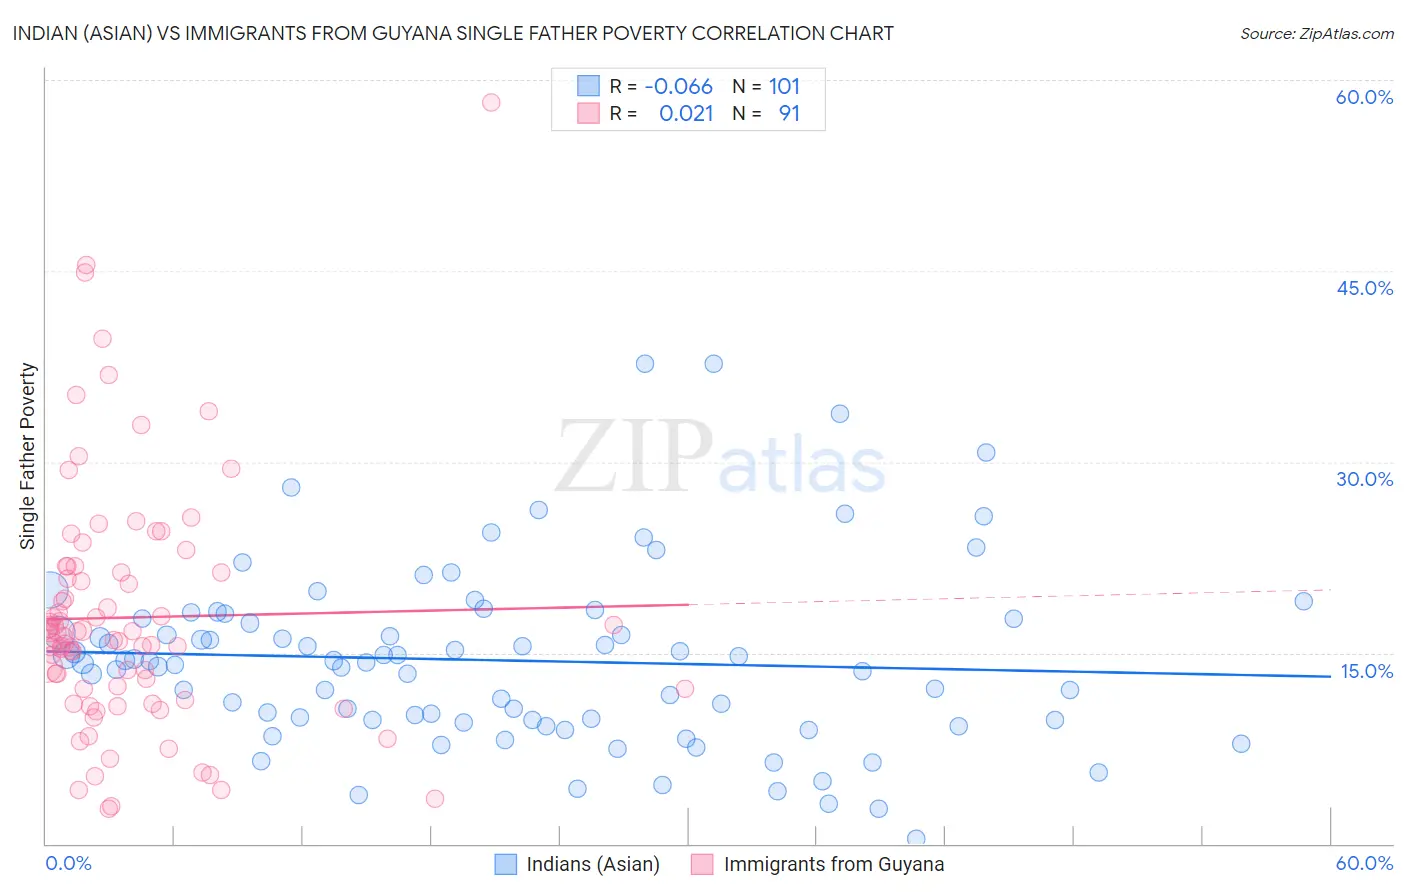
Indian (Asian) vs Immigrants from Guyana Single Father Poverty Correlation Chart
The statistical analysis conducted on geographies consisting of 373,368,189 people shows a slight negative correlation between the proportion of Indians (Asian) and poverty level among single fathers in the United States with a correlation coefficient (R) of -0.066 and weighted average of 14.8%. Similarly, the statistical analysis conducted on geographies consisting of 157,234,374 people shows no correlation between the proportion of Immigrants from Guyana and poverty level among single fathers in the United States with a correlation coefficient (R) of 0.021 and weighted average of 16.5%, a difference of 11.4%.
Single Father Poverty Correlation Summary
| Measurement | Indian (Asian) | Immigrants from Guyana |
| Minimum | 0.43% | 2.8% |
| Maximum | 37.7% | 58.2% |
| Range | 37.3% | 55.4% |
| Mean | 14.4% | 17.8% |
| Median | 14.2% | 16.3% |
| Interquartile 25% (IQ1) | 9.7% | 12.2% |
| Interquartile 75% (IQ3) | 17.7% | 21.3% |
| Interquartile Range (IQR) | 8.0% | 9.1% |
| Standard Deviation (Sample) | 7.1% | 9.7% |
| Standard Deviation (Population) | 7.0% | 9.6% |
Similar Demographics by Single Father Poverty
Demographics Similar to Indians (Asian) by Single Father Poverty
In terms of single father poverty, the demographic groups most similar to Indians (Asian) are Immigrants from Nepal (14.8%, a difference of 0.0%), Immigrants from Eritrea (14.8%, a difference of 0.040%), Pima (14.8%, a difference of 0.17%), Immigrants from Asia (14.7%, a difference of 0.37%), and Bolivian (14.7%, a difference of 0.54%).
| Demographics | Rating | Rank | Single Father Poverty |
| Egyptians | 100.0 /100 | #34 | Exceptional 14.7% |
| Immigrants | Bolivia | 100.0 /100 | #35 | Exceptional 14.7% |
| Immigrants | Indonesia | 100.0 /100 | #36 | Exceptional 14.7% |
| Immigrants | Eastern Africa | 100.0 /100 | #37 | Exceptional 14.7% |
| Bolivians | 100.0 /100 | #38 | Exceptional 14.7% |
| Immigrants | Asia | 100.0 /100 | #39 | Exceptional 14.7% |
| Pima | 100.0 /100 | #40 | Exceptional 14.8% |
| Indians (Asian) | 100.0 /100 | #41 | Exceptional 14.8% |
| Immigrants | Nepal | 100.0 /100 | #42 | Exceptional 14.8% |
| Immigrants | Eritrea | 100.0 /100 | #43 | Exceptional 14.8% |
| Salvadorans | 100.0 /100 | #44 | Exceptional 14.9% |
| Immigrants | Somalia | 100.0 /100 | #45 | Exceptional 14.9% |
| Immigrants | Cambodia | 99.9 /100 | #46 | Exceptional 14.9% |
| Immigrants | China | 99.9 /100 | #47 | Exceptional 14.9% |
| Malaysians | 99.9 /100 | #48 | Exceptional 14.9% |
Demographics Similar to Immigrants from Guyana by Single Father Poverty
In terms of single father poverty, the demographic groups most similar to Immigrants from Guyana are Immigrants from Burma/Myanmar (16.5%, a difference of 0.050%), Latvian (16.5%, a difference of 0.10%), Immigrants from Switzerland (16.5%, a difference of 0.13%), Ecuadorian (16.5%, a difference of 0.15%), and Russian (16.4%, a difference of 0.16%).
| Demographics | Rating | Rank | Single Father Poverty |
| Cambodians | 34.6 /100 | #184 | Fair 16.4% |
| Panamanians | 33.6 /100 | #185 | Fair 16.4% |
| Immigrants | Venezuela | 31.0 /100 | #186 | Fair 16.4% |
| Ukrainians | 30.4 /100 | #187 | Fair 16.4% |
| Russians | 30.1 /100 | #188 | Fair 16.4% |
| Latvians | 28.9 /100 | #189 | Fair 16.5% |
| Immigrants | Burma/Myanmar | 28.0 /100 | #190 | Fair 16.5% |
| Immigrants | Guyana | 27.1 /100 | #191 | Fair 16.5% |
| Immigrants | Switzerland | 24.8 /100 | #192 | Fair 16.5% |
| Ecuadorians | 24.5 /100 | #193 | Fair 16.5% |
| Cape Verdeans | 24.4 /100 | #194 | Fair 16.5% |
| Immigrants | Barbados | 24.3 /100 | #195 | Fair 16.5% |
| Immigrants | Canada | 21.9 /100 | #196 | Fair 16.5% |
| Immigrants | Northern Europe | 20.3 /100 | #197 | Fair 16.5% |
| Romanians | 20.1 /100 | #198 | Fair 16.5% |