Immigrants vs Chippewa Associate's Degree
COMPARE
Immigrants
Chippewa
Associate's Degree
Associate's Degree Comparison
Immigrants
Chippewa
44.5%
ASSOCIATE'S DEGREE
10.5/ 100
METRIC RATING
217th/ 347
METRIC RANK
40.7%
ASSOCIATE'S DEGREE
0.2/ 100
METRIC RATING
270th/ 347
METRIC RANK
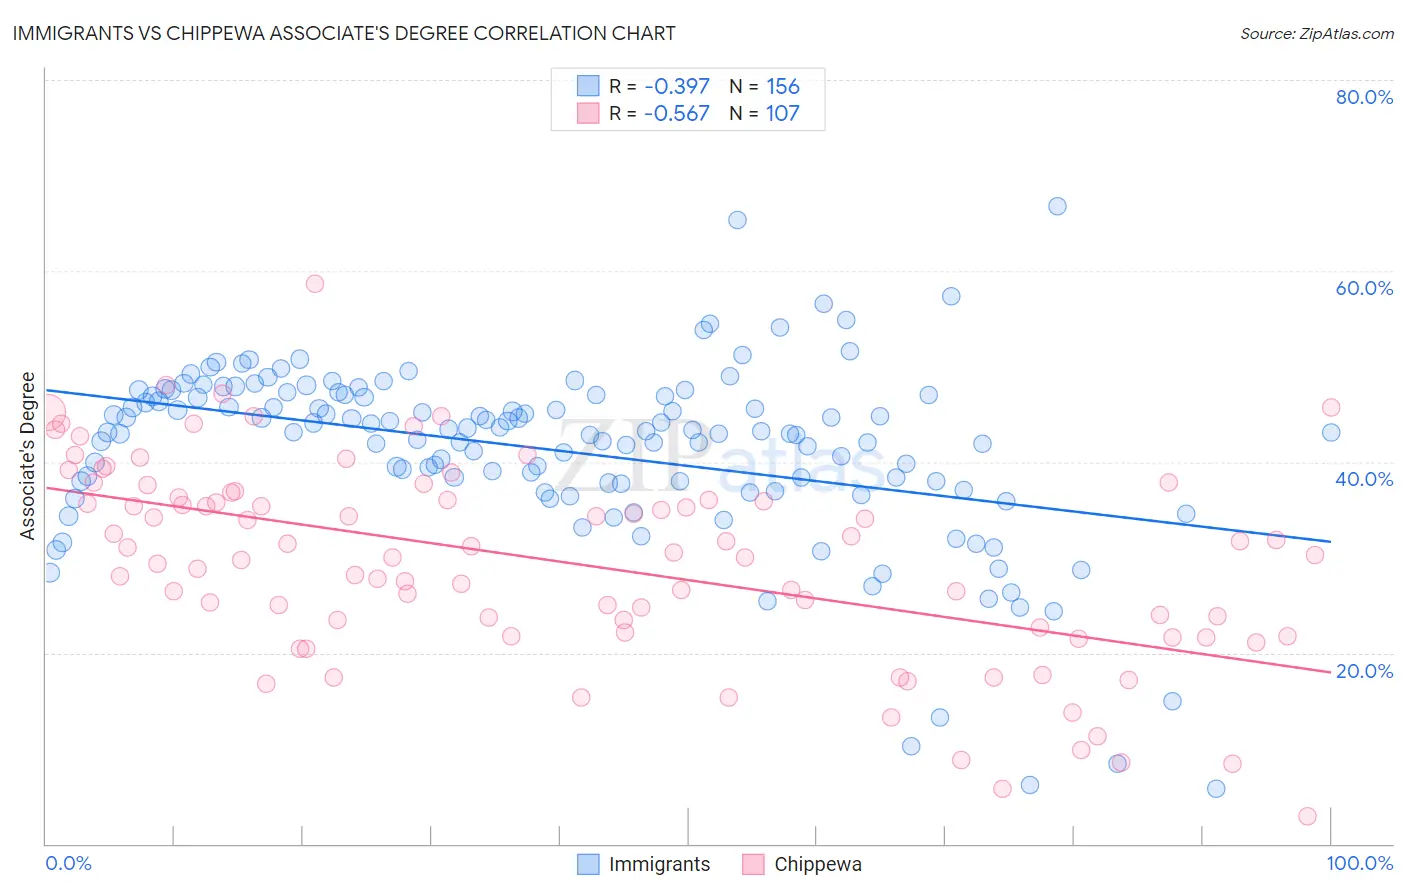
Immigrants vs Chippewa Associate's Degree Correlation Chart
The statistical analysis conducted on geographies consisting of 577,638,441 people shows a mild negative correlation between the proportion of Immigrants and percentage of population with at least associate's degree education in the United States with a correlation coefficient (R) of -0.397 and weighted average of 44.5%. Similarly, the statistical analysis conducted on geographies consisting of 215,061,498 people shows a substantial negative correlation between the proportion of Chippewa and percentage of population with at least associate's degree education in the United States with a correlation coefficient (R) of -0.567 and weighted average of 40.7%, a difference of 9.2%.
Associate's Degree Correlation Summary
| Measurement | Immigrants | Chippewa |
| Minimum | 5.7% | 2.9% |
| Maximum | 66.8% | 58.7% |
| Range | 61.1% | 55.8% |
| Mean | 41.2% | 29.5% |
| Median | 43.1% | 30.2% |
| Interquartile 25% (IQ1) | 37.8% | 22.1% |
| Interquartile 75% (IQ3) | 46.9% | 36.2% |
| Interquartile Range (IQR) | 9.1% | 14.1% |
| Standard Deviation (Sample) | 9.6% | 10.5% |
| Standard Deviation (Population) | 9.5% | 10.4% |
Similar Demographics by Associate's Degree
Demographics Similar to Immigrants by Associate's Degree
In terms of associate's degree, the demographic groups most similar to Immigrants are Immigrants from Nigeria (44.6%, a difference of 0.19%), Spanish (44.4%, a difference of 0.25%), Immigrants from Panama (44.7%, a difference of 0.37%), Immigrants from Middle Africa (44.7%, a difference of 0.42%), and Immigrants from Ghana (44.8%, a difference of 0.68%).
| Demographics | Rating | Rank | Associate's Degree |
| Immigrants | Philippines | 16.7 /100 | #210 | Poor 45.0% |
| Immigrants | Zaire | 16.6 /100 | #211 | Poor 45.0% |
| French Canadians | 15.0 /100 | #212 | Poor 44.9% |
| Immigrants | Ghana | 14.2 /100 | #213 | Poor 44.8% |
| Immigrants | Middle Africa | 12.7 /100 | #214 | Poor 44.7% |
| Immigrants | Panama | 12.4 /100 | #215 | Poor 44.7% |
| Immigrants | Nigeria | 11.4 /100 | #216 | Poor 44.6% |
| Immigrants | Immigrants | 10.5 /100 | #217 | Poor 44.5% |
| Spanish | 9.4 /100 | #218 | Tragic 44.4% |
| Whites/Caucasians | 7.5 /100 | #219 | Tragic 44.2% |
| Portuguese | 7.2 /100 | #220 | Tragic 44.1% |
| Immigrants | Western Africa | 6.6 /100 | #221 | Tragic 44.1% |
| Barbadians | 5.8 /100 | #222 | Tragic 43.9% |
| Sub-Saharan Africans | 5.5 /100 | #223 | Tragic 43.9% |
| West Indians | 5.2 /100 | #224 | Tragic 43.8% |
Demographics Similar to Chippewa by Associate's Degree
In terms of associate's degree, the demographic groups most similar to Chippewa are American (40.8%, a difference of 0.050%), Immigrants from Laos (40.7%, a difference of 0.18%), Central American Indian (40.8%, a difference of 0.23%), Belizean (40.6%, a difference of 0.25%), and Hawaiian (40.9%, a difference of 0.42%).
| Demographics | Rating | Rank | Associate's Degree |
| Immigrants | Jamaica | 0.3 /100 | #263 | Tragic 41.5% |
| Osage | 0.3 /100 | #264 | Tragic 41.5% |
| Africans | 0.2 /100 | #265 | Tragic 41.1% |
| Samoans | 0.2 /100 | #266 | Tragic 41.1% |
| Hawaiians | 0.2 /100 | #267 | Tragic 40.9% |
| Central American Indians | 0.2 /100 | #268 | Tragic 40.8% |
| Americans | 0.2 /100 | #269 | Tragic 40.8% |
| Chippewa | 0.2 /100 | #270 | Tragic 40.7% |
| Immigrants | Laos | 0.1 /100 | #271 | Tragic 40.7% |
| Belizeans | 0.1 /100 | #272 | Tragic 40.6% |
| Puget Sound Salish | 0.1 /100 | #273 | Tragic 40.5% |
| Immigrants | Dominica | 0.1 /100 | #274 | Tragic 40.5% |
| Potawatomi | 0.1 /100 | #275 | Tragic 40.4% |
| Puerto Ricans | 0.1 /100 | #276 | Tragic 40.4% |
| Blackfeet | 0.1 /100 | #277 | Tragic 40.3% |