Immigrants from the Azores vs Immigrants from Netherlands Married-couple Households
COMPARE
Immigrants from the Azores
Immigrants from Netherlands
Married-couple Households
Married-couple Households Comparison
Immigrants from the Azores
Immigrants from Netherlands
45.2%
MARRIED-COUPLE HOUSEHOLDS
5.3/ 100
METRIC RATING
218th/ 347
METRIC RANK
48.2%
MARRIED-COUPLE HOUSEHOLDS
98.2/ 100
METRIC RATING
79th/ 347
METRIC RANK
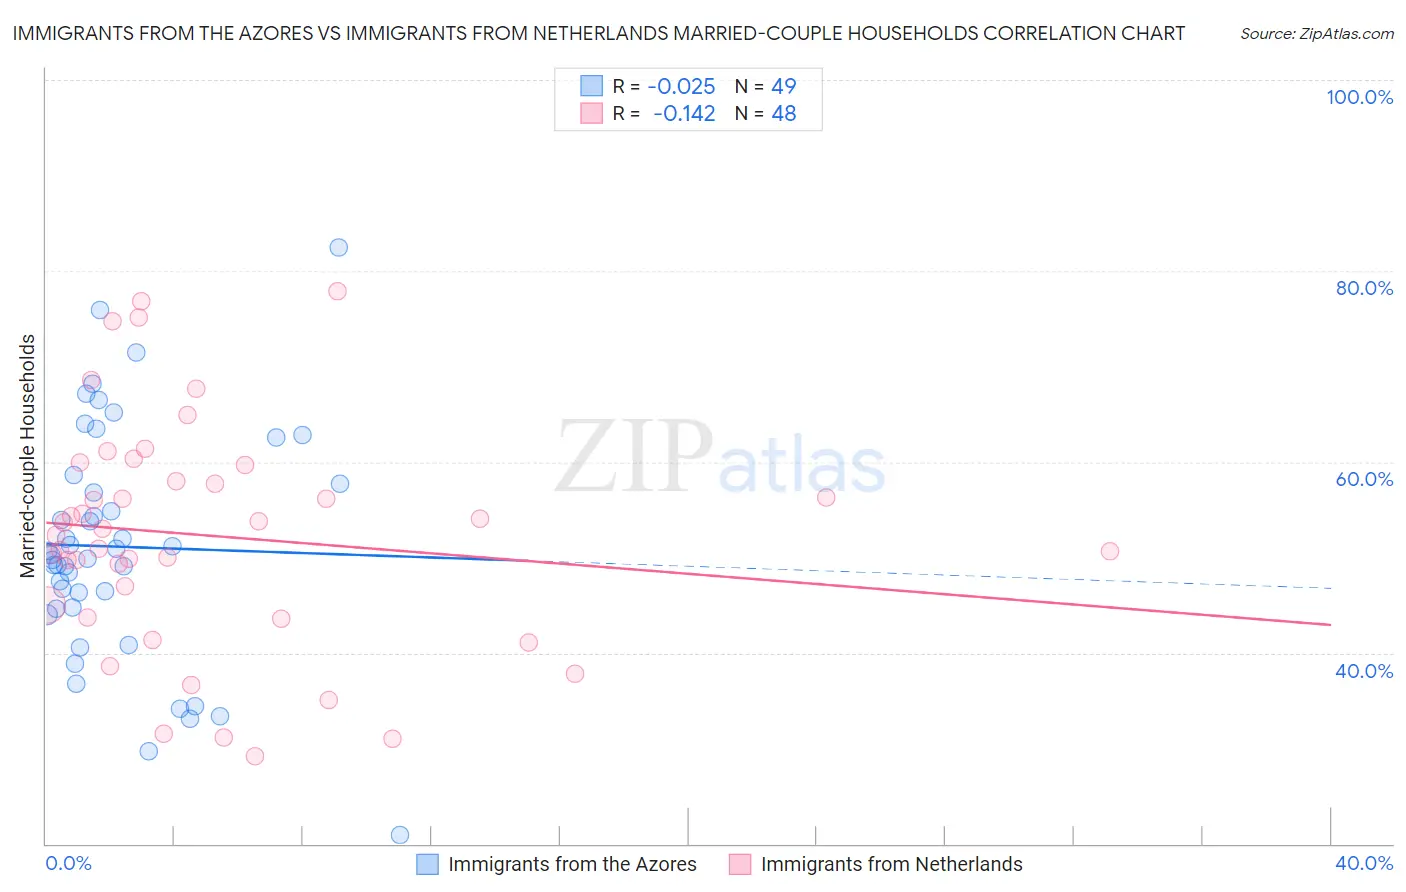
Immigrants from the Azores vs Immigrants from Netherlands Married-couple Households Correlation Chart
The statistical analysis conducted on geographies consisting of 46,257,310 people shows no correlation between the proportion of Immigrants from the Azores and percentage of married-couple family households in the United States with a correlation coefficient (R) of -0.025 and weighted average of 45.2%. Similarly, the statistical analysis conducted on geographies consisting of 237,797,342 people shows a poor negative correlation between the proportion of Immigrants from Netherlands and percentage of married-couple family households in the United States with a correlation coefficient (R) of -0.142 and weighted average of 48.2%, a difference of 6.6%.
Married-couple Households Correlation Summary
| Measurement | Immigrants from the Azores | Immigrants from Netherlands |
| Minimum | 21.0% | 29.2% |
| Maximum | 82.5% | 77.9% |
| Range | 61.5% | 48.7% |
| Mean | 51.1% | 52.3% |
| Median | 50.2% | 52.7% |
| Interquartile 25% (IQ1) | 44.7% | 44.4% |
| Interquartile 75% (IQ3) | 58.1% | 58.8% |
| Interquartile Range (IQR) | 13.4% | 14.4% |
| Standard Deviation (Sample) | 12.2% | 12.0% |
| Standard Deviation (Population) | 12.1% | 11.9% |
Similar Demographics by Married-couple Households
Demographics Similar to Immigrants from the Azores by Married-couple Households
In terms of married-couple households, the demographic groups most similar to Immigrants from the Azores are Nicaraguan (45.2%, a difference of 0.010%), Panamanian (45.2%, a difference of 0.030%), Immigrants from Thailand (45.2%, a difference of 0.040%), Immigrants from Nepal (45.2%, a difference of 0.050%), and Immigrants from Portugal (45.2%, a difference of 0.050%).
| Demographics | Rating | Rank | Married-couple Households |
| Immigrants | Spain | 7.3 /100 | #211 | Tragic 45.3% |
| Creek | 6.4 /100 | #212 | Tragic 45.3% |
| Yakama | 5.8 /100 | #213 | Tragic 45.2% |
| Japanese | 5.7 /100 | #214 | Tragic 45.2% |
| Immigrants | Nepal | 5.6 /100 | #215 | Tragic 45.2% |
| Immigrants | Portugal | 5.6 /100 | #216 | Tragic 45.2% |
| Panamanians | 5.5 /100 | #217 | Tragic 45.2% |
| Immigrants | Azores | 5.3 /100 | #218 | Tragic 45.2% |
| Nicaraguans | 5.3 /100 | #219 | Tragic 45.2% |
| Immigrants | Thailand | 5.1 /100 | #220 | Tragic 45.2% |
| Tlingit-Haida | 4.9 /100 | #221 | Tragic 45.1% |
| Immigrants | Laos | 4.6 /100 | #222 | Tragic 45.1% |
| Immigrants | Cambodia | 2.7 /100 | #223 | Tragic 44.9% |
| Immigrants | Micronesia | 2.6 /100 | #224 | Tragic 44.9% |
| Dutch West Indians | 2.6 /100 | #225 | Tragic 44.9% |
Demographics Similar to Immigrants from Netherlands by Married-couple Households
In terms of married-couple households, the demographic groups most similar to Immigrants from Netherlands are Egyptian (48.2%, a difference of 0.010%), Russian (48.2%, a difference of 0.020%), Canadian (48.2%, a difference of 0.030%), Finnish (48.1%, a difference of 0.090%), and Immigrants from Fiji (48.2%, a difference of 0.12%).
| Demographics | Rating | Rank | Married-couple Households |
| Scotch-Irish | 98.6 /100 | #72 | Exceptional 48.3% |
| Immigrants | Singapore | 98.6 /100 | #73 | Exceptional 48.3% |
| Immigrants | Romania | 98.6 /100 | #74 | Exceptional 48.3% |
| Immigrants | England | 98.4 /100 | #75 | Exceptional 48.2% |
| Immigrants | Fiji | 98.4 /100 | #76 | Exceptional 48.2% |
| Canadians | 98.2 /100 | #77 | Exceptional 48.2% |
| Egyptians | 98.2 /100 | #78 | Exceptional 48.2% |
| Immigrants | Netherlands | 98.2 /100 | #79 | Exceptional 48.2% |
| Russians | 98.1 /100 | #80 | Exceptional 48.2% |
| Finns | 98.0 /100 | #81 | Exceptional 48.1% |
| Immigrants | Poland | 97.7 /100 | #82 | Exceptional 48.1% |
| Guamanians/Chamorros | 97.6 /100 | #83 | Exceptional 48.1% |
| Ukrainians | 97.6 /100 | #84 | Exceptional 48.1% |
| Immigrants | Israel | 97.4 /100 | #85 | Exceptional 48.0% |
| Belgians | 97.4 /100 | #86 | Exceptional 48.0% |