Immigrants from Zimbabwe vs Immigrants from Western Asia Married-couple Households
COMPARE
Immigrants from Zimbabwe
Immigrants from Western Asia
Married-couple Households
Married-couple Households Comparison
Immigrants from Zimbabwe
Immigrants from Western Asia
46.3%
MARRIED-COUPLE HOUSEHOLDS
43.0/ 100
METRIC RATING
179th/ 347
METRIC RANK
46.9%
MARRIED-COUPLE HOUSEHOLDS
76.1/ 100
METRIC RATING
154th/ 347
METRIC RANK
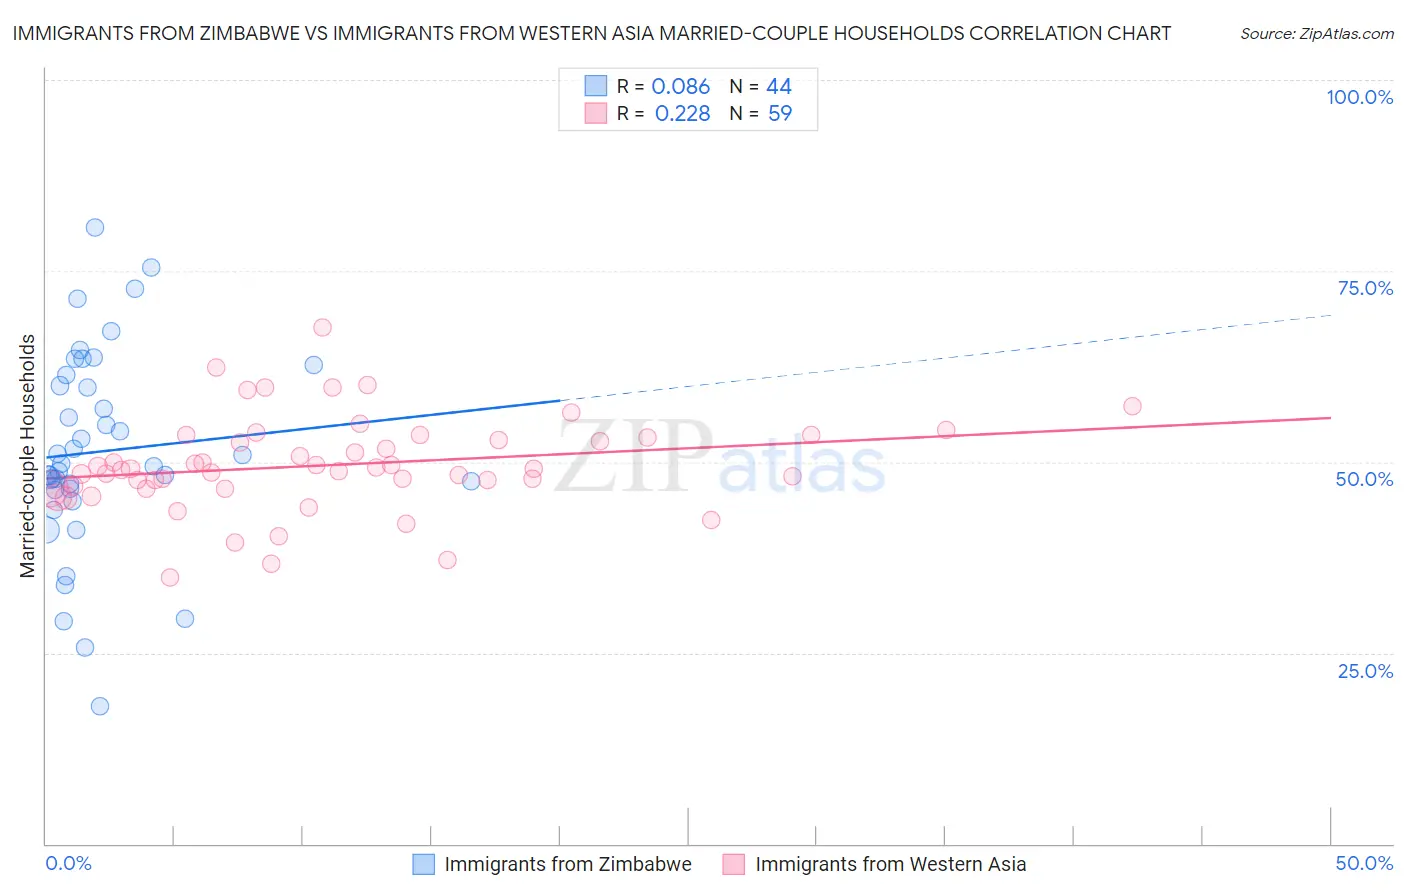
Immigrants from Zimbabwe vs Immigrants from Western Asia Married-couple Households Correlation Chart
The statistical analysis conducted on geographies consisting of 117,791,116 people shows a slight positive correlation between the proportion of Immigrants from Zimbabwe and percentage of married-couple family households in the United States with a correlation coefficient (R) of 0.086 and weighted average of 46.3%. Similarly, the statistical analysis conducted on geographies consisting of 404,157,089 people shows a weak positive correlation between the proportion of Immigrants from Western Asia and percentage of married-couple family households in the United States with a correlation coefficient (R) of 0.228 and weighted average of 46.9%, a difference of 1.4%.
Married-couple Households Correlation Summary
| Measurement | Immigrants from Zimbabwe | Immigrants from Western Asia |
| Minimum | 17.9% | 34.9% |
| Maximum | 80.8% | 67.5% |
| Range | 62.8% | 32.6% |
| Mean | 51.4% | 49.6% |
| Median | 49.6% | 49.1% |
| Interquartile 25% (IQ1) | 46.4% | 46.6% |
| Interquartile 75% (IQ3) | 60.6% | 53.1% |
| Interquartile Range (IQR) | 14.2% | 6.6% |
| Standard Deviation (Sample) | 13.1% | 6.2% |
| Standard Deviation (Population) | 13.0% | 6.1% |
Similar Demographics by Married-couple Households
Demographics Similar to Immigrants from Zimbabwe by Married-couple Households
In terms of married-couple households, the demographic groups most similar to Immigrants from Zimbabwe are Immigrants from Costa Rica (46.3%, a difference of 0.010%), Immigrants (46.3%, a difference of 0.030%), Mongolian (46.3%, a difference of 0.040%), Malaysian (46.3%, a difference of 0.050%), and Cajun (46.4%, a difference of 0.090%).
| Demographics | Rating | Rank | Married-couple Households |
| Immigrants | Australia | 54.6 /100 | #172 | Average 46.5% |
| Immigrants | Norway | 52.0 /100 | #173 | Average 46.5% |
| Immigrants | Mexico | 50.0 /100 | #174 | Average 46.4% |
| Immigrants | Colombia | 46.1 /100 | #175 | Average 46.4% |
| Cajuns | 45.2 /100 | #176 | Average 46.4% |
| Immigrants | Immigrants | 43.8 /100 | #177 | Average 46.3% |
| Immigrants | Costa Rica | 43.4 /100 | #178 | Average 46.3% |
| Immigrants | Zimbabwe | 43.0 /100 | #179 | Average 46.3% |
| Mongolians | 42.0 /100 | #180 | Average 46.3% |
| Malaysians | 41.8 /100 | #181 | Average 46.3% |
| Yugoslavians | 38.9 /100 | #182 | Fair 46.2% |
| Immigrants | Brazil | 38.3 /100 | #183 | Fair 46.2% |
| Immigrants | Switzerland | 36.9 /100 | #184 | Fair 46.2% |
| Brazilians | 35.9 /100 | #185 | Fair 46.2% |
| Albanians | 31.1 /100 | #186 | Fair 46.1% |
Demographics Similar to Immigrants from Western Asia by Married-couple Households
In terms of married-couple households, the demographic groups most similar to Immigrants from Western Asia are Hmong (47.0%, a difference of 0.0%), Serbian (47.0%, a difference of 0.010%), Arab (46.9%, a difference of 0.010%), Immigrants from Bulgaria (47.0%, a difference of 0.040%), and Armenian (46.9%, a difference of 0.040%).
| Demographics | Rating | Rank | Married-couple Households |
| Immigrants | Syria | 81.6 /100 | #147 | Excellent 47.1% |
| Icelanders | 79.5 /100 | #148 | Good 47.0% |
| Paraguayans | 78.7 /100 | #149 | Good 47.0% |
| Immigrants | Russia | 77.6 /100 | #150 | Good 47.0% |
| Immigrants | Bulgaria | 76.8 /100 | #151 | Good 47.0% |
| Serbians | 76.3 /100 | #152 | Good 47.0% |
| Hmong | 76.2 /100 | #153 | Good 47.0% |
| Immigrants | Western Asia | 76.1 /100 | #154 | Good 46.9% |
| Arabs | 76.0 /100 | #155 | Good 46.9% |
| Armenians | 75.4 /100 | #156 | Good 46.9% |
| Immigrants | Oceania | 74.8 /100 | #157 | Good 46.9% |
| Immigrants | Nonimmigrants | 73.3 /100 | #158 | Good 46.9% |
| Osage | 73.2 /100 | #159 | Good 46.9% |
| Iraqis | 71.7 /100 | #160 | Good 46.9% |
| Delaware | 71.2 /100 | #161 | Good 46.8% |