Immigrants from Zimbabwe vs Immigrants from Austria Married-couple Households
COMPARE
Immigrants from Zimbabwe
Immigrants from Austria
Married-couple Households
Married-couple Households Comparison
Immigrants from Zimbabwe
Immigrants from Austria
46.3%
MARRIED-COUPLE HOUSEHOLDS
43.0/ 100
METRIC RATING
179th/ 347
METRIC RANK
47.9%
MARRIED-COUPLE HOUSEHOLDS
96.4/ 100
METRIC RATING
99th/ 347
METRIC RANK
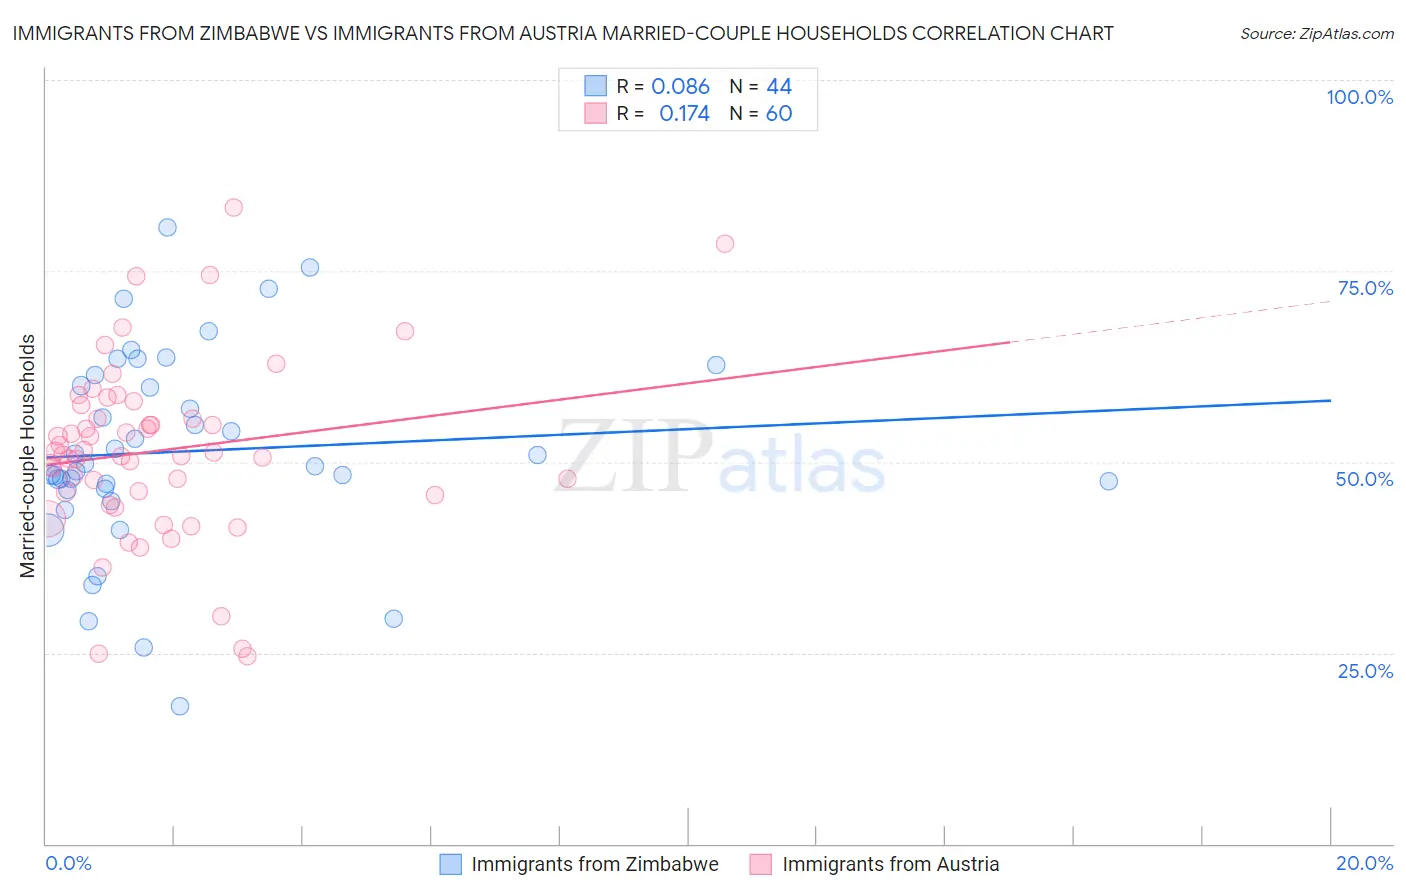
Immigrants from Zimbabwe vs Immigrants from Austria Married-couple Households Correlation Chart
The statistical analysis conducted on geographies consisting of 117,791,116 people shows a slight positive correlation between the proportion of Immigrants from Zimbabwe and percentage of married-couple family households in the United States with a correlation coefficient (R) of 0.086 and weighted average of 46.3%. Similarly, the statistical analysis conducted on geographies consisting of 167,961,473 people shows a poor positive correlation between the proportion of Immigrants from Austria and percentage of married-couple family households in the United States with a correlation coefficient (R) of 0.174 and weighted average of 47.9%, a difference of 3.4%.
Married-couple Households Correlation Summary
| Measurement | Immigrants from Zimbabwe | Immigrants from Austria |
| Minimum | 17.9% | 24.5% |
| Maximum | 80.8% | 83.3% |
| Range | 62.8% | 58.8% |
| Mean | 51.4% | 51.5% |
| Median | 49.6% | 51.0% |
| Interquartile 25% (IQ1) | 46.4% | 45.8% |
| Interquartile 75% (IQ3) | 60.6% | 56.6% |
| Interquartile Range (IQR) | 14.2% | 10.8% |
| Standard Deviation (Sample) | 13.1% | 11.7% |
| Standard Deviation (Population) | 13.0% | 11.6% |
Similar Demographics by Married-couple Households
Demographics Similar to Immigrants from Zimbabwe by Married-couple Households
In terms of married-couple households, the demographic groups most similar to Immigrants from Zimbabwe are Immigrants from Costa Rica (46.3%, a difference of 0.010%), Immigrants (46.3%, a difference of 0.030%), Mongolian (46.3%, a difference of 0.040%), Malaysian (46.3%, a difference of 0.050%), and Cajun (46.4%, a difference of 0.090%).
| Demographics | Rating | Rank | Married-couple Households |
| Immigrants | Australia | 54.6 /100 | #172 | Average 46.5% |
| Immigrants | Norway | 52.0 /100 | #173 | Average 46.5% |
| Immigrants | Mexico | 50.0 /100 | #174 | Average 46.4% |
| Immigrants | Colombia | 46.1 /100 | #175 | Average 46.4% |
| Cajuns | 45.2 /100 | #176 | Average 46.4% |
| Immigrants | Immigrants | 43.8 /100 | #177 | Average 46.3% |
| Immigrants | Costa Rica | 43.4 /100 | #178 | Average 46.3% |
| Immigrants | Zimbabwe | 43.0 /100 | #179 | Average 46.3% |
| Mongolians | 42.0 /100 | #180 | Average 46.3% |
| Malaysians | 41.8 /100 | #181 | Average 46.3% |
| Yugoslavians | 38.9 /100 | #182 | Fair 46.2% |
| Immigrants | Brazil | 38.3 /100 | #183 | Fair 46.2% |
| Immigrants | Switzerland | 36.9 /100 | #184 | Fair 46.2% |
| Brazilians | 35.9 /100 | #185 | Fair 46.2% |
| Albanians | 31.1 /100 | #186 | Fair 46.1% |
Demographics Similar to Immigrants from Austria by Married-couple Households
In terms of married-couple households, the demographic groups most similar to Immigrants from Austria are Immigrants from North Macedonia (47.9%, a difference of 0.010%), Immigrants from Italy (47.9%, a difference of 0.010%), Latvian (47.9%, a difference of 0.020%), Immigrants from Egypt (47.9%, a difference of 0.050%), and Turkish (47.8%, a difference of 0.070%).
| Demographics | Rating | Rank | Married-couple Households |
| Palestinians | 96.9 /100 | #92 | Exceptional 48.0% |
| Lebanese | 96.9 /100 | #93 | Exceptional 47.9% |
| Americans | 96.9 /100 | #94 | Exceptional 47.9% |
| Immigrants | Belgium | 96.8 /100 | #95 | Exceptional 47.9% |
| Immigrants | Egypt | 96.6 /100 | #96 | Exceptional 47.9% |
| Latvians | 96.5 /100 | #97 | Exceptional 47.9% |
| Immigrants | North Macedonia | 96.4 /100 | #98 | Exceptional 47.9% |
| Immigrants | Austria | 96.4 /100 | #99 | Exceptional 47.9% |
| Immigrants | Italy | 96.3 /100 | #100 | Exceptional 47.9% |
| Turks | 96.1 /100 | #101 | Exceptional 47.8% |
| Slavs | 96.0 /100 | #102 | Exceptional 47.8% |
| Hawaiians | 96.0 /100 | #103 | Exceptional 47.8% |
| Immigrants | South Africa | 96.0 /100 | #104 | Exceptional 47.8% |
| Immigrants | Czechoslovakia | 95.5 /100 | #105 | Exceptional 47.8% |
| Portuguese | 95.5 /100 | #106 | Exceptional 47.8% |