Immigrants from Western Asia vs Creek Married-couple Households
COMPARE
Immigrants from Western Asia
Creek
Married-couple Households
Married-couple Households Comparison
Immigrants from Western Asia
Creek
46.9%
MARRIED-COUPLE HOUSEHOLDS
76.1/ 100
METRIC RATING
154th/ 347
METRIC RANK
45.3%
MARRIED-COUPLE HOUSEHOLDS
6.4/ 100
METRIC RATING
212th/ 347
METRIC RANK
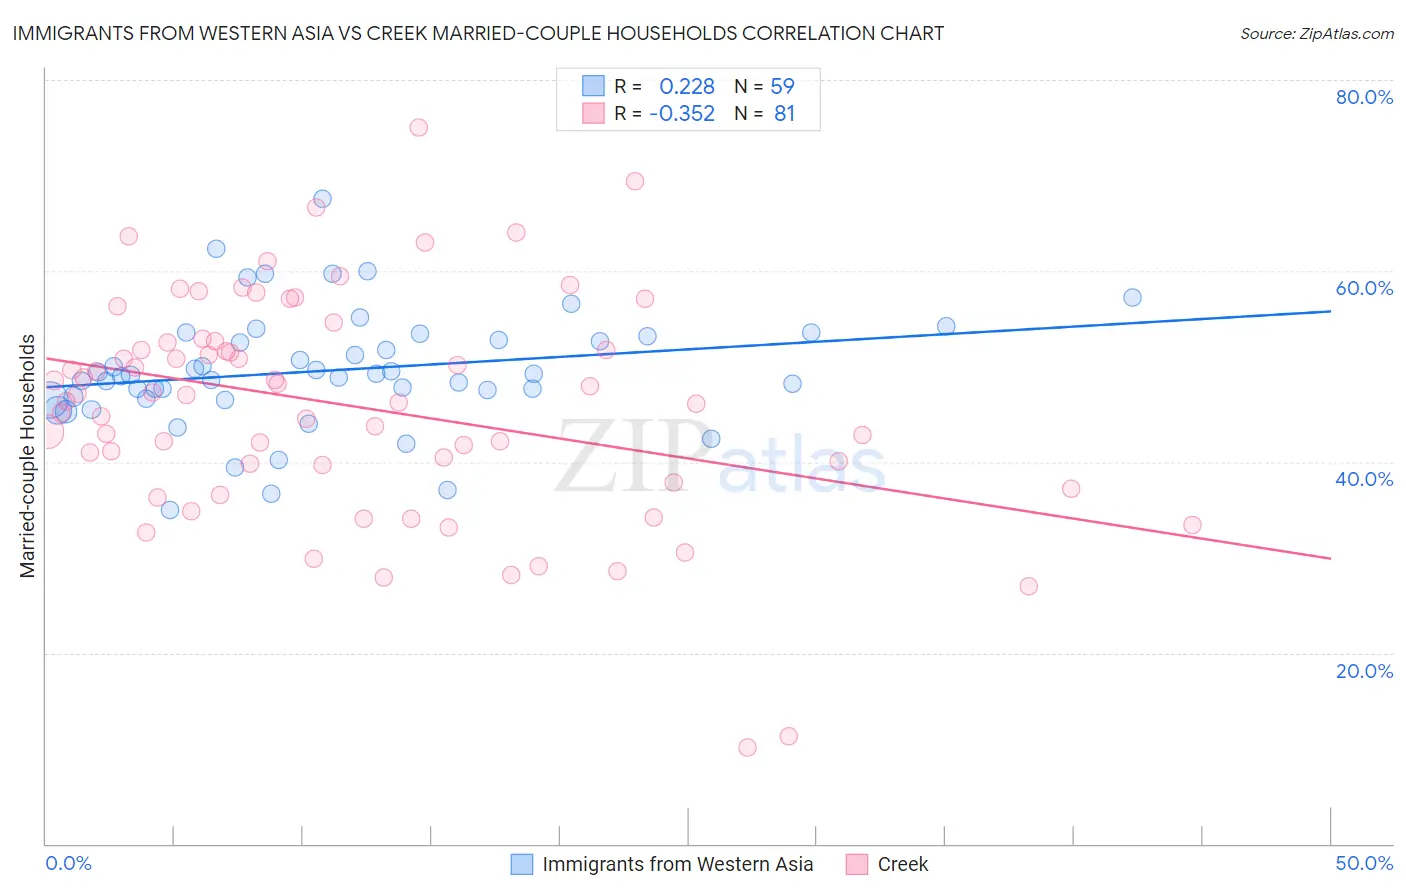
Immigrants from Western Asia vs Creek Married-couple Households Correlation Chart
The statistical analysis conducted on geographies consisting of 404,157,089 people shows a weak positive correlation between the proportion of Immigrants from Western Asia and percentage of married-couple family households in the United States with a correlation coefficient (R) of 0.228 and weighted average of 46.9%. Similarly, the statistical analysis conducted on geographies consisting of 178,433,601 people shows a mild negative correlation between the proportion of Creek and percentage of married-couple family households in the United States with a correlation coefficient (R) of -0.352 and weighted average of 45.3%, a difference of 3.7%.
Married-couple Households Correlation Summary
| Measurement | Immigrants from Western Asia | Creek |
| Minimum | 34.9% | 10.1% |
| Maximum | 67.5% | 75.0% |
| Range | 32.6% | 64.9% |
| Mean | 49.6% | 45.8% |
| Median | 49.1% | 47.0% |
| Interquartile 25% (IQ1) | 46.6% | 38.8% |
| Interquartile 75% (IQ3) | 53.1% | 52.6% |
| Interquartile Range (IQR) | 6.6% | 13.9% |
| Standard Deviation (Sample) | 6.2% | 11.8% |
| Standard Deviation (Population) | 6.1% | 11.7% |
Similar Demographics by Married-couple Households
Demographics Similar to Immigrants from Western Asia by Married-couple Households
In terms of married-couple households, the demographic groups most similar to Immigrants from Western Asia are Hmong (47.0%, a difference of 0.0%), Serbian (47.0%, a difference of 0.010%), Arab (46.9%, a difference of 0.010%), Immigrants from Bulgaria (47.0%, a difference of 0.040%), and Armenian (46.9%, a difference of 0.040%).
| Demographics | Rating | Rank | Married-couple Households |
| Immigrants | Syria | 81.6 /100 | #147 | Excellent 47.1% |
| Icelanders | 79.5 /100 | #148 | Good 47.0% |
| Paraguayans | 78.7 /100 | #149 | Good 47.0% |
| Immigrants | Russia | 77.6 /100 | #150 | Good 47.0% |
| Immigrants | Bulgaria | 76.8 /100 | #151 | Good 47.0% |
| Serbians | 76.3 /100 | #152 | Good 47.0% |
| Hmong | 76.2 /100 | #153 | Good 47.0% |
| Immigrants | Western Asia | 76.1 /100 | #154 | Good 46.9% |
| Arabs | 76.0 /100 | #155 | Good 46.9% |
| Armenians | 75.4 /100 | #156 | Good 46.9% |
| Immigrants | Oceania | 74.8 /100 | #157 | Good 46.9% |
| Immigrants | Nonimmigrants | 73.3 /100 | #158 | Good 46.9% |
| Osage | 73.2 /100 | #159 | Good 46.9% |
| Iraqis | 71.7 /100 | #160 | Good 46.9% |
| Delaware | 71.2 /100 | #161 | Good 46.8% |
Demographics Similar to Creek by Married-couple Households
In terms of married-couple households, the demographic groups most similar to Creek are Yakama (45.2%, a difference of 0.10%), Immigrants from Spain (45.3%, a difference of 0.13%), Japanese (45.2%, a difference of 0.13%), Immigrants from Nepal (45.2%, a difference of 0.15%), and Immigrants from Portugal (45.2%, a difference of 0.15%).
| Demographics | Rating | Rank | Married-couple Households |
| Nepalese | 11.9 /100 | #205 | Poor 45.6% |
| Uruguayans | 10.4 /100 | #206 | Poor 45.5% |
| Immigrants | France | 8.8 /100 | #207 | Tragic 45.4% |
| Hispanics or Latinos | 8.7 /100 | #208 | Tragic 45.4% |
| Immigrants | Uzbekistan | 8.4 /100 | #209 | Tragic 45.4% |
| Cubans | 7.7 /100 | #210 | Tragic 45.4% |
| Immigrants | Spain | 7.3 /100 | #211 | Tragic 45.3% |
| Creek | 6.4 /100 | #212 | Tragic 45.3% |
| Yakama | 5.8 /100 | #213 | Tragic 45.2% |
| Japanese | 5.7 /100 | #214 | Tragic 45.2% |
| Immigrants | Nepal | 5.6 /100 | #215 | Tragic 45.2% |
| Immigrants | Portugal | 5.6 /100 | #216 | Tragic 45.2% |
| Panamanians | 5.5 /100 | #217 | Tragic 45.2% |
| Immigrants | Azores | 5.3 /100 | #218 | Tragic 45.2% |
| Nicaraguans | 5.3 /100 | #219 | Tragic 45.2% |