Immigrants from Western Asia vs Immigrants from Ukraine Married-couple Households
COMPARE
Immigrants from Western Asia
Immigrants from Ukraine
Married-couple Households
Married-couple Households Comparison
Immigrants from Western Asia
Immigrants from Ukraine
46.9%
MARRIED-COUPLE HOUSEHOLDS
76.1/ 100
METRIC RATING
154th/ 347
METRIC RANK
47.3%
MARRIED-COUPLE HOUSEHOLDS
86.7/ 100
METRIC RATING
132nd/ 347
METRIC RANK
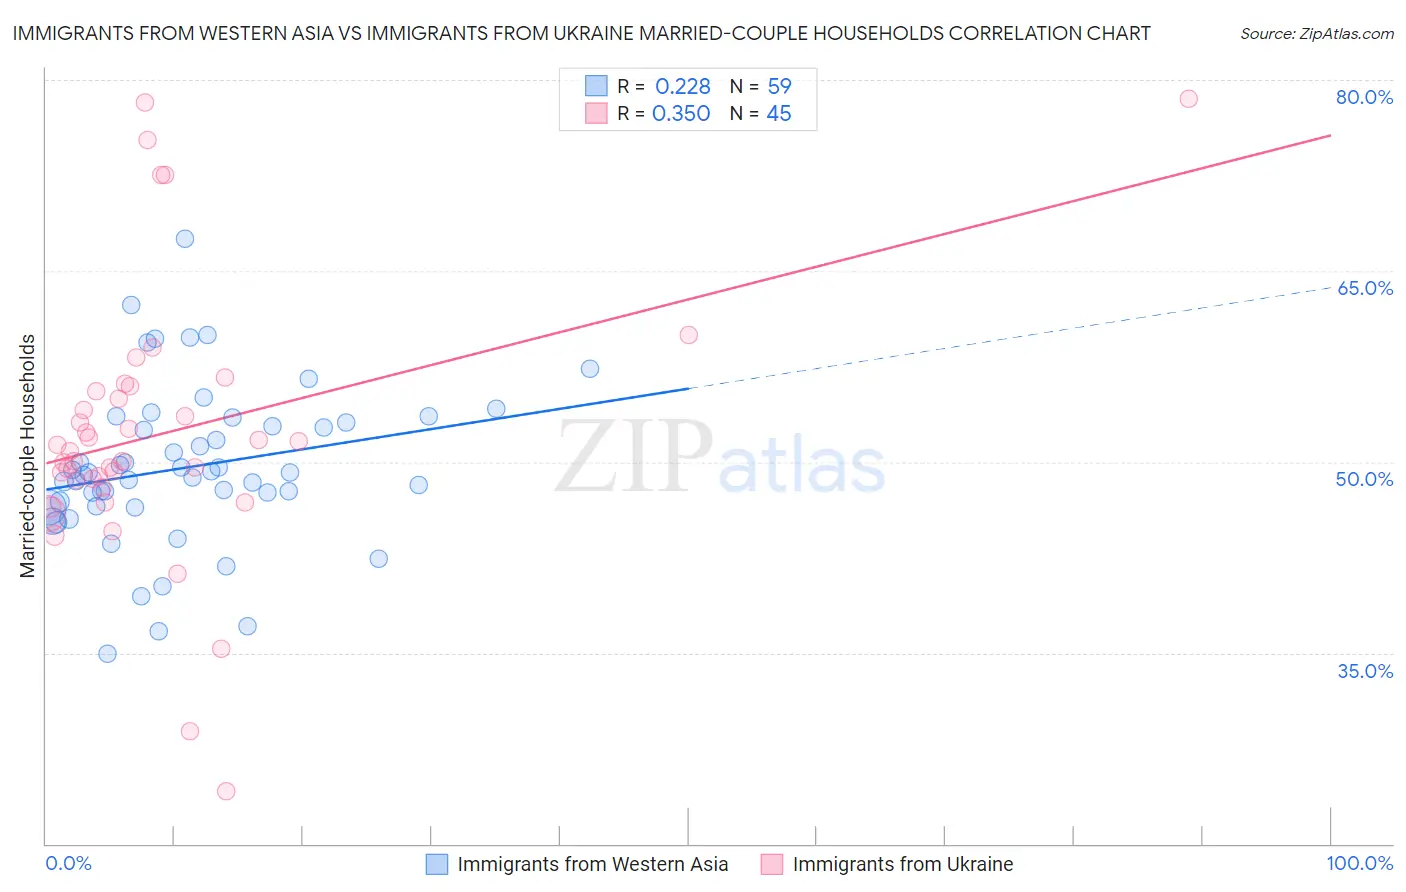
Immigrants from Western Asia vs Immigrants from Ukraine Married-couple Households Correlation Chart
The statistical analysis conducted on geographies consisting of 404,157,089 people shows a weak positive correlation between the proportion of Immigrants from Western Asia and percentage of married-couple family households in the United States with a correlation coefficient (R) of 0.228 and weighted average of 46.9%. Similarly, the statistical analysis conducted on geographies consisting of 289,643,450 people shows a mild positive correlation between the proportion of Immigrants from Ukraine and percentage of married-couple family households in the United States with a correlation coefficient (R) of 0.350 and weighted average of 47.3%, a difference of 0.67%.
Married-couple Households Correlation Summary
| Measurement | Immigrants from Western Asia | Immigrants from Ukraine |
| Minimum | 34.9% | 24.1% |
| Maximum | 67.5% | 78.6% |
| Range | 32.6% | 54.4% |
| Mean | 49.6% | 52.3% |
| Median | 49.1% | 50.8% |
| Interquartile 25% (IQ1) | 46.6% | 48.3% |
| Interquartile 75% (IQ3) | 53.1% | 55.7% |
| Interquartile Range (IQR) | 6.6% | 7.5% |
| Standard Deviation (Sample) | 6.2% | 10.7% |
| Standard Deviation (Population) | 6.1% | 10.6% |
Similar Demographics by Married-couple Households
Demographics Similar to Immigrants from Western Asia by Married-couple Households
In terms of married-couple households, the demographic groups most similar to Immigrants from Western Asia are Hmong (47.0%, a difference of 0.0%), Serbian (47.0%, a difference of 0.010%), Arab (46.9%, a difference of 0.010%), Immigrants from Bulgaria (47.0%, a difference of 0.040%), and Armenian (46.9%, a difference of 0.040%).
| Demographics | Rating | Rank | Married-couple Households |
| Immigrants | Syria | 81.6 /100 | #147 | Excellent 47.1% |
| Icelanders | 79.5 /100 | #148 | Good 47.0% |
| Paraguayans | 78.7 /100 | #149 | Good 47.0% |
| Immigrants | Russia | 77.6 /100 | #150 | Good 47.0% |
| Immigrants | Bulgaria | 76.8 /100 | #151 | Good 47.0% |
| Serbians | 76.3 /100 | #152 | Good 47.0% |
| Hmong | 76.2 /100 | #153 | Good 47.0% |
| Immigrants | Western Asia | 76.1 /100 | #154 | Good 46.9% |
| Arabs | 76.0 /100 | #155 | Good 46.9% |
| Armenians | 75.4 /100 | #156 | Good 46.9% |
| Immigrants | Oceania | 74.8 /100 | #157 | Good 46.9% |
| Immigrants | Nonimmigrants | 73.3 /100 | #158 | Good 46.9% |
| Osage | 73.2 /100 | #159 | Good 46.9% |
| Iraqis | 71.7 /100 | #160 | Good 46.9% |
| Delaware | 71.2 /100 | #161 | Good 46.8% |
Demographics Similar to Immigrants from Ukraine by Married-couple Households
In terms of married-couple households, the demographic groups most similar to Immigrants from Ukraine are South African (47.3%, a difference of 0.020%), Immigrants from Greece (47.2%, a difference of 0.060%), Immigrants from Argentina (47.2%, a difference of 0.060%), Immigrants from Denmark (47.3%, a difference of 0.070%), and Immigrants from Iraq (47.3%, a difference of 0.090%).
| Demographics | Rating | Rank | Married-couple Households |
| Australians | 89.0 /100 | #125 | Excellent 47.4% |
| Pakistanis | 88.6 /100 | #126 | Excellent 47.3% |
| Celtics | 88.1 /100 | #127 | Excellent 47.3% |
| Immigrants | Peru | 87.9 /100 | #128 | Excellent 47.3% |
| Immigrants | Iraq | 87.8 /100 | #129 | Excellent 47.3% |
| Immigrants | Hungary | 87.8 /100 | #130 | Excellent 47.3% |
| Immigrants | Denmark | 87.5 /100 | #131 | Excellent 47.3% |
| Immigrants | Ukraine | 86.7 /100 | #132 | Excellent 47.3% |
| South Africans | 86.4 /100 | #133 | Excellent 47.3% |
| Immigrants | Greece | 86.0 /100 | #134 | Excellent 47.2% |
| Immigrants | Argentina | 86.0 /100 | #135 | Excellent 47.2% |
| New Zealanders | 85.3 /100 | #136 | Excellent 47.2% |
| Immigrants | Malaysia | 85.2 /100 | #137 | Excellent 47.2% |
| Immigrants | Afghanistan | 85.1 /100 | #138 | Excellent 47.2% |
| Immigrants | Sweden | 84.7 /100 | #139 | Excellent 47.2% |