Immigrants from West Indies vs Immigrants from Venezuela Family Households
COMPARE
Immigrants from West Indies
Immigrants from Venezuela
Family Households
Family Households Comparison
Immigrants from West Indies
Immigrants from Venezuela
61.6%
FAMILY HOUSEHOLDS
0.0/ 100
METRIC RATING
324th/ 347
METRIC RANK
66.4%
FAMILY HOUSEHOLDS
100.0/ 100
METRIC RATING
48th/ 347
METRIC RANK
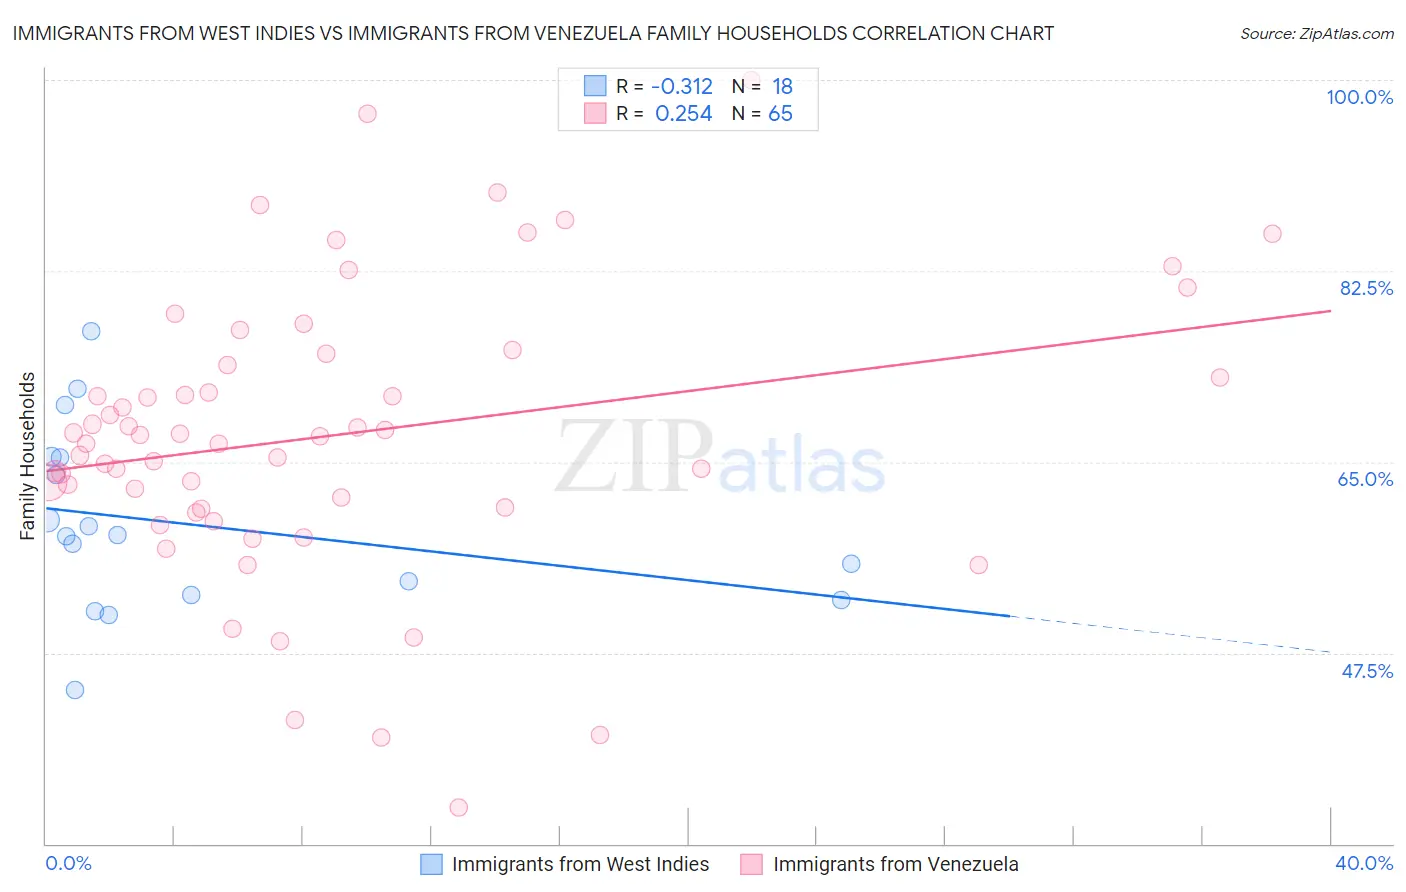
Immigrants from West Indies vs Immigrants from Venezuela Family Households Correlation Chart
The statistical analysis conducted on geographies consisting of 72,452,456 people shows a mild negative correlation between the proportion of Immigrants from West Indies and percentage of family households in the United States with a correlation coefficient (R) of -0.312 and weighted average of 61.6%. Similarly, the statistical analysis conducted on geographies consisting of 287,786,549 people shows a weak positive correlation between the proportion of Immigrants from Venezuela and percentage of family households in the United States with a correlation coefficient (R) of 0.254 and weighted average of 66.4%, a difference of 7.9%.
Family Households Correlation Summary
| Measurement | Immigrants from West Indies | Immigrants from Venezuela |
| Minimum | 44.1% | 33.3% |
| Maximum | 77.0% | 100.0% |
| Range | 32.9% | 66.7% |
| Mean | 59.3% | 67.5% |
| Median | 58.3% | 67.4% |
| Interquartile 25% (IQ1) | 52.8% | 60.7% |
| Interquartile 75% (IQ3) | 65.4% | 74.4% |
| Interquartile Range (IQR) | 12.5% | 13.6% |
| Standard Deviation (Sample) | 8.3% | 13.1% |
| Standard Deviation (Population) | 8.1% | 13.0% |
Similar Demographics by Family Households
Demographics Similar to Immigrants from West Indies by Family Households
In terms of family households, the demographic groups most similar to Immigrants from West Indies are Immigrants from Serbia (61.6%, a difference of 0.010%), Tlingit-Haida (61.6%, a difference of 0.010%), Immigrants from Switzerland (61.6%, a difference of 0.010%), Alsatian (61.7%, a difference of 0.10%), and Ugandan (61.7%, a difference of 0.16%).
| Demographics | Rating | Rank | Family Households |
| Immigrants | Bosnia and Herzegovina | 0.0 /100 | #317 | Tragic 61.9% |
| Alaskan Athabascans | 0.0 /100 | #318 | Tragic 61.8% |
| Cape Verdeans | 0.0 /100 | #319 | Tragic 61.8% |
| Ugandans | 0.0 /100 | #320 | Tragic 61.7% |
| Alsatians | 0.0 /100 | #321 | Tragic 61.7% |
| Immigrants | Serbia | 0.0 /100 | #322 | Tragic 61.6% |
| Tlingit-Haida | 0.0 /100 | #323 | Tragic 61.6% |
| Immigrants | West Indies | 0.0 /100 | #324 | Tragic 61.6% |
| Immigrants | Switzerland | 0.0 /100 | #325 | Tragic 61.6% |
| Indonesians | 0.0 /100 | #326 | Tragic 61.5% |
| Blacks/African Americans | 0.0 /100 | #327 | Tragic 61.5% |
| Kiowa | 0.0 /100 | #328 | Tragic 61.4% |
| Cambodians | 0.0 /100 | #329 | Tragic 61.4% |
| Immigrants | Australia | 0.0 /100 | #330 | Tragic 61.3% |
| Immigrants | France | 0.0 /100 | #331 | Tragic 61.3% |
Demographics Similar to Immigrants from Venezuela by Family Households
In terms of family households, the demographic groups most similar to Immigrants from Venezuela are Bolivian (66.5%, a difference of 0.020%), Arapaho (66.5%, a difference of 0.050%), Immigrants from South Central Asia (66.4%, a difference of 0.050%), Venezuelan (66.5%, a difference of 0.070%), and Asian (66.5%, a difference of 0.090%).
| Demographics | Rating | Rank | Family Households |
| Immigrants | Bolivia | 100.0 /100 | #41 | Exceptional 66.6% |
| Menominee | 100.0 /100 | #42 | Exceptional 66.5% |
| Apache | 100.0 /100 | #43 | Exceptional 66.5% |
| Asians | 100.0 /100 | #44 | Exceptional 66.5% |
| Venezuelans | 100.0 /100 | #45 | Exceptional 66.5% |
| Arapaho | 100.0 /100 | #46 | Exceptional 66.5% |
| Bolivians | 100.0 /100 | #47 | Exceptional 66.5% |
| Immigrants | Venezuela | 100.0 /100 | #48 | Exceptional 66.4% |
| Immigrants | South Central Asia | 100.0 /100 | #49 | Exceptional 66.4% |
| Navajo | 100.0 /100 | #50 | Exceptional 66.4% |
| Natives/Alaskans | 100.0 /100 | #51 | Exceptional 66.4% |
| Colombians | 100.0 /100 | #52 | Exceptional 66.3% |
| Afghans | 100.0 /100 | #53 | Exceptional 66.3% |
| Immigrants | Colombia | 100.0 /100 | #54 | Exceptional 66.3% |
| Immigrants | Immigrants | 100.0 /100 | #55 | Exceptional 66.1% |