Immigrants from West Indies vs Jordanian Family Households
COMPARE
Immigrants from West Indies
Jordanian
Family Households
Family Households Comparison
Immigrants from West Indies
Jordanians
61.6%
FAMILY HOUSEHOLDS
0.0/ 100
METRIC RATING
324th/ 347
METRIC RANK
65.5%
FAMILY HOUSEHOLDS
99.7/ 100
METRIC RATING
81st/ 347
METRIC RANK
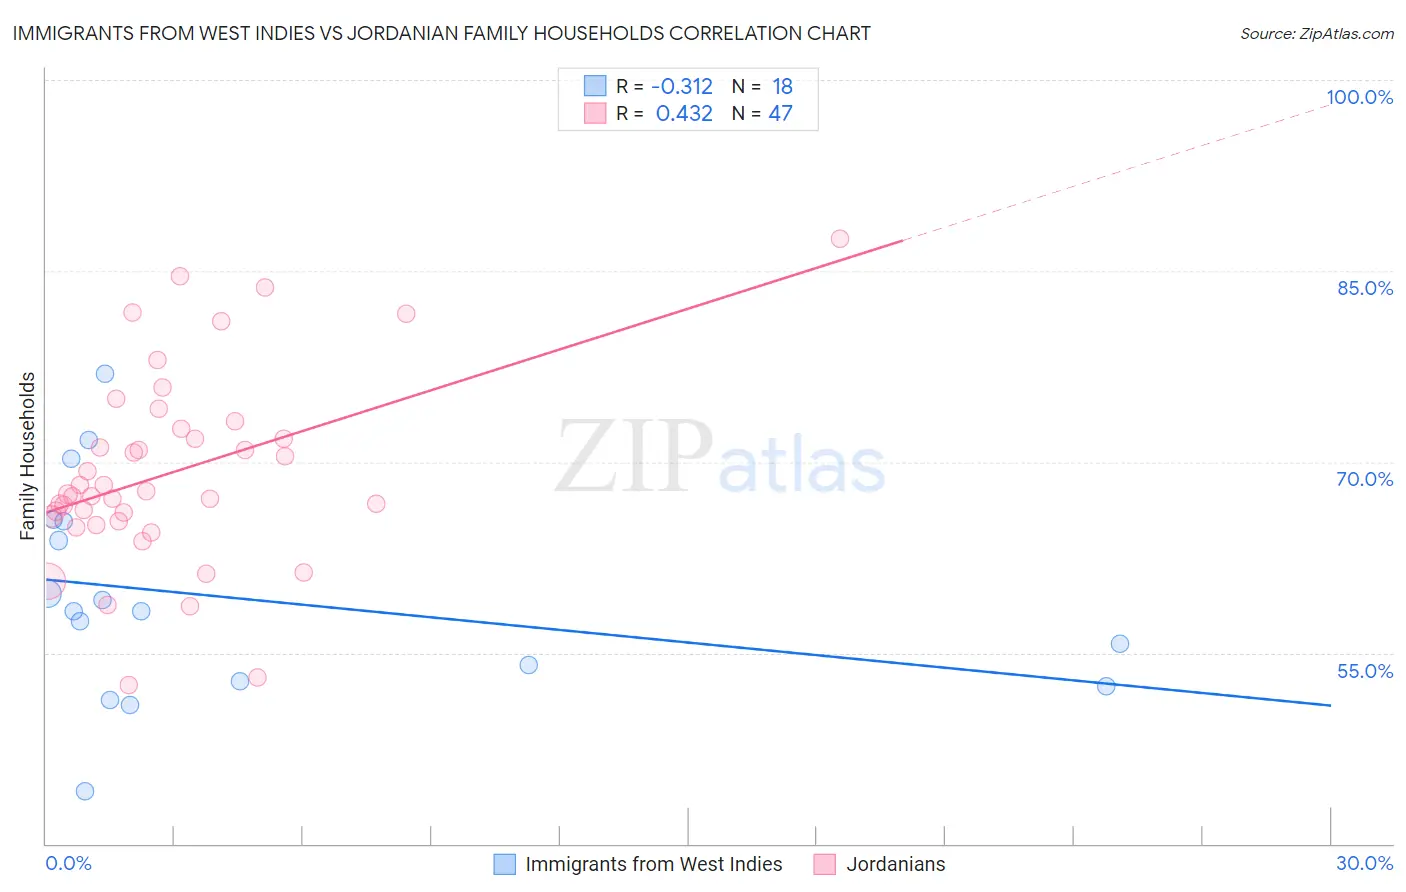
Immigrants from West Indies vs Jordanian Family Households Correlation Chart
The statistical analysis conducted on geographies consisting of 72,452,456 people shows a mild negative correlation between the proportion of Immigrants from West Indies and percentage of family households in the United States with a correlation coefficient (R) of -0.312 and weighted average of 61.6%. Similarly, the statistical analysis conducted on geographies consisting of 166,395,405 people shows a moderate positive correlation between the proportion of Jordanians and percentage of family households in the United States with a correlation coefficient (R) of 0.432 and weighted average of 65.5%, a difference of 6.4%.
Family Households Correlation Summary
| Measurement | Immigrants from West Indies | Jordanian |
| Minimum | 44.1% | 52.5% |
| Maximum | 77.0% | 87.5% |
| Range | 32.9% | 35.0% |
| Mean | 59.3% | 69.1% |
| Median | 58.3% | 67.5% |
| Interquartile 25% (IQ1) | 52.8% | 65.3% |
| Interquartile 75% (IQ3) | 65.4% | 72.6% |
| Interquartile Range (IQR) | 12.5% | 7.3% |
| Standard Deviation (Sample) | 8.3% | 7.5% |
| Standard Deviation (Population) | 8.1% | 7.5% |
Similar Demographics by Family Households
Demographics Similar to Immigrants from West Indies by Family Households
In terms of family households, the demographic groups most similar to Immigrants from West Indies are Immigrants from Serbia (61.6%, a difference of 0.010%), Tlingit-Haida (61.6%, a difference of 0.010%), Immigrants from Switzerland (61.6%, a difference of 0.010%), Alsatian (61.7%, a difference of 0.10%), and Ugandan (61.7%, a difference of 0.16%).
| Demographics | Rating | Rank | Family Households |
| Immigrants | Bosnia and Herzegovina | 0.0 /100 | #317 | Tragic 61.9% |
| Alaskan Athabascans | 0.0 /100 | #318 | Tragic 61.8% |
| Cape Verdeans | 0.0 /100 | #319 | Tragic 61.8% |
| Ugandans | 0.0 /100 | #320 | Tragic 61.7% |
| Alsatians | 0.0 /100 | #321 | Tragic 61.7% |
| Immigrants | Serbia | 0.0 /100 | #322 | Tragic 61.6% |
| Tlingit-Haida | 0.0 /100 | #323 | Tragic 61.6% |
| Immigrants | West Indies | 0.0 /100 | #324 | Tragic 61.6% |
| Immigrants | Switzerland | 0.0 /100 | #325 | Tragic 61.6% |
| Indonesians | 0.0 /100 | #326 | Tragic 61.5% |
| Blacks/African Americans | 0.0 /100 | #327 | Tragic 61.5% |
| Kiowa | 0.0 /100 | #328 | Tragic 61.4% |
| Cambodians | 0.0 /100 | #329 | Tragic 61.4% |
| Immigrants | Australia | 0.0 /100 | #330 | Tragic 61.3% |
| Immigrants | France | 0.0 /100 | #331 | Tragic 61.3% |
Demographics Similar to Jordanians by Family Households
In terms of family households, the demographic groups most similar to Jordanians are Immigrants from Lebanon (65.5%, a difference of 0.040%), Immigrants from Guyana (65.5%, a difference of 0.040%), American (65.5%, a difference of 0.060%), Puget Sound Salish (65.6%, a difference of 0.080%), and Immigrants from Costa Rica (65.6%, a difference of 0.10%).
| Demographics | Rating | Rank | Family Households |
| Burmese | 99.9 /100 | #74 | Exceptional 65.7% |
| Houma | 99.9 /100 | #75 | Exceptional 65.7% |
| Immigrants | Azores | 99.8 /100 | #76 | Exceptional 65.6% |
| Immigrants | South America | 99.8 /100 | #77 | Exceptional 65.6% |
| Yaqui | 99.8 /100 | #78 | Exceptional 65.6% |
| Immigrants | Costa Rica | 99.8 /100 | #79 | Exceptional 65.6% |
| Puget Sound Salish | 99.8 /100 | #80 | Exceptional 65.6% |
| Jordanians | 99.7 /100 | #81 | Exceptional 65.5% |
| Immigrants | Lebanon | 99.7 /100 | #82 | Exceptional 65.5% |
| Immigrants | Guyana | 99.6 /100 | #83 | Exceptional 65.5% |
| Americans | 99.6 /100 | #84 | Exceptional 65.5% |
| Immigrants | Cambodia | 99.5 /100 | #85 | Exceptional 65.4% |
| Egyptians | 99.4 /100 | #86 | Exceptional 65.4% |
| Immigrants | Egypt | 99.2 /100 | #87 | Exceptional 65.3% |
| Immigrants | Haiti | 99.1 /100 | #88 | Exceptional 65.3% |