Immigrants from Uzbekistan vs Immigrants from Middle Africa Average Family Size
COMPARE
Immigrants from Uzbekistan
Immigrants from Middle Africa
Average Family Size
Average Family Size Comparison
Immigrants from Uzbekistan
Immigrants from Middle Africa
3.24
AVERAGE FAMILY SIZE
67.0/ 100
METRIC RATING
157th/ 347
METRIC RANK
3.25
AVERAGE FAMILY SIZE
82.4/ 100
METRIC RATING
137th/ 347
METRIC RANK
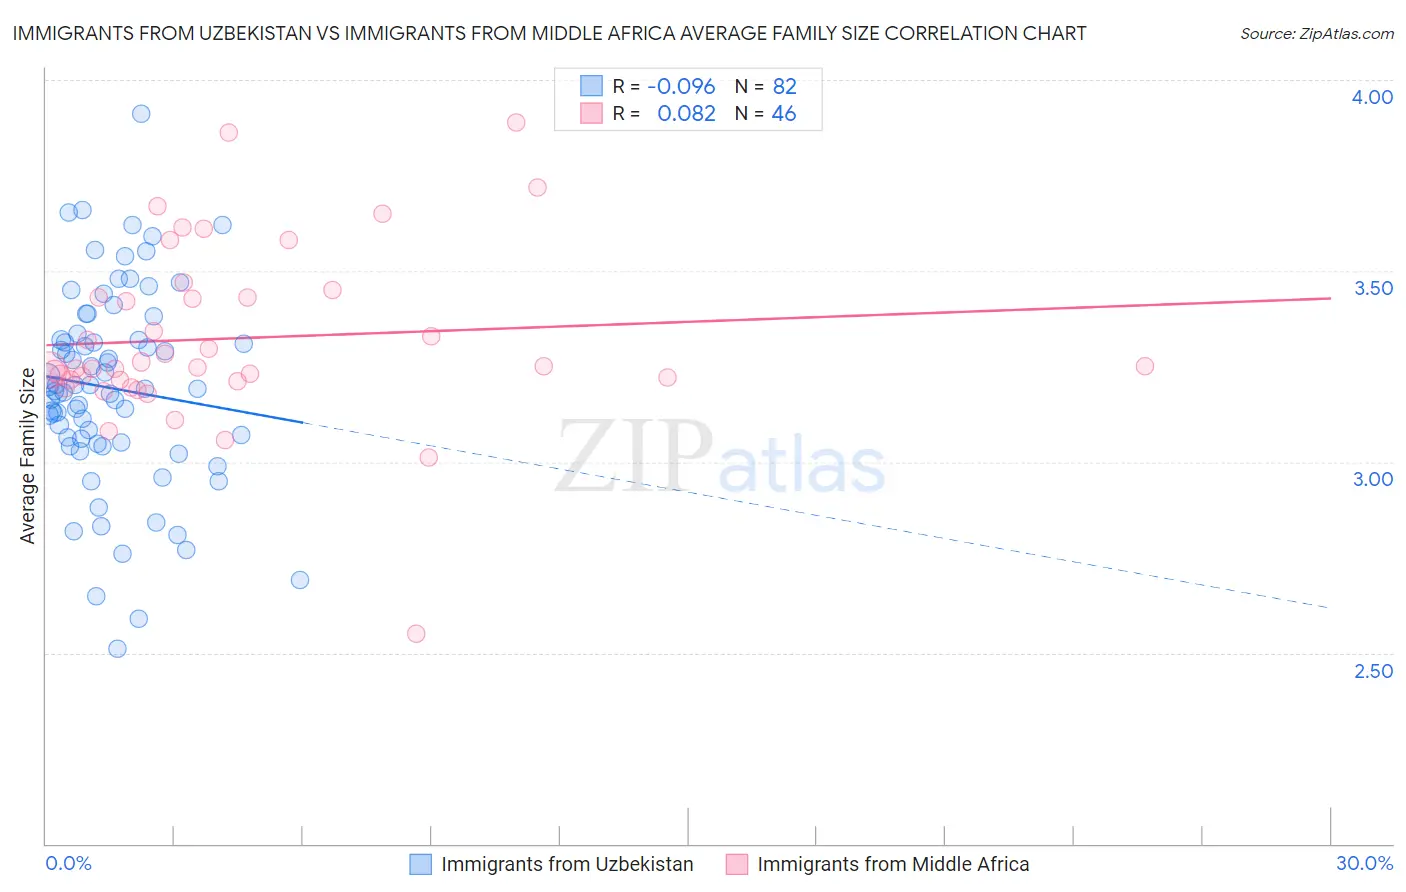
Immigrants from Uzbekistan vs Immigrants from Middle Africa Average Family Size Correlation Chart
The statistical analysis conducted on geographies consisting of 118,722,943 people shows a slight negative correlation between the proportion of Immigrants from Uzbekistan and average family size in the United States with a correlation coefficient (R) of -0.096 and weighted average of 3.24. Similarly, the statistical analysis conducted on geographies consisting of 202,632,157 people shows a slight positive correlation between the proportion of Immigrants from Middle Africa and average family size in the United States with a correlation coefficient (R) of 0.082 and weighted average of 3.25, a difference of 0.38%.
Average Family Size Correlation Summary
| Measurement | Immigrants from Uzbekistan | Immigrants from Middle Africa |
| Minimum | 2.51 | 2.55 |
| Maximum | 3.91 | 3.89 |
| Range | 1.40 | 1.34 |
| Mean | 3.19 | 3.32 |
| Median | 3.19 | 3.25 |
| Interquartile 25% (IQ1) | 3.05 | 3.21 |
| Interquartile 75% (IQ3) | 3.32 | 3.43 |
| Interquartile Range (IQR) | 0.27 | 0.21 |
| Standard Deviation (Sample) | 0.26 | 0.23 |
| Standard Deviation (Population) | 0.26 | 0.23 |
Demographics Similar to Immigrants from Uzbekistan and Immigrants from Middle Africa by Average Family Size
In terms of average family size, the demographic groups most similar to Immigrants from Uzbekistan are Seminole (3.24, a difference of 0.020%), Immigrants from Taiwan (3.24, a difference of 0.020%), Immigrants from Egypt (3.24, a difference of 0.060%), Immigrants from Eritrea (3.24, a difference of 0.090%), and Spanish American (3.24, a difference of 0.12%). Similarly, the demographic groups most similar to Immigrants from Middle Africa are Cuban (3.25, a difference of 0.020%), Immigrants from Ethiopia (3.25, a difference of 0.020%), Subsaharan African (3.25, a difference of 0.020%), Venezuelan (3.25, a difference of 0.030%), and Liberian (3.25, a difference of 0.030%).
| Demographics | Rating | Rank | Average Family Size |
| Immigrants | Middle Africa | 82.4 /100 | #137 | Excellent 3.25 |
| Cubans | 81.8 /100 | #138 | Excellent 3.25 |
| Immigrants | Ethiopia | 81.6 /100 | #139 | Excellent 3.25 |
| Sub-Saharan Africans | 81.6 /100 | #140 | Excellent 3.25 |
| Venezuelans | 81.4 /100 | #141 | Excellent 3.25 |
| Liberians | 81.2 /100 | #142 | Excellent 3.25 |
| Bhutanese | 81.0 /100 | #143 | Excellent 3.25 |
| Tsimshian | 80.2 /100 | #144 | Excellent 3.25 |
| Armenians | 78.2 /100 | #145 | Good 3.25 |
| Immigrants | Africa | 77.9 /100 | #146 | Good 3.25 |
| Immigrants | Jordan | 75.7 /100 | #147 | Good 3.24 |
| Blackfeet | 75.0 /100 | #148 | Good 3.24 |
| Assyrians/Chaldeans/Syriacs | 73.8 /100 | #149 | Good 3.24 |
| Indians (Asian) | 73.6 /100 | #150 | Good 3.24 |
| Jordanians | 73.5 /100 | #151 | Good 3.24 |
| Spanish Americans | 72.5 /100 | #152 | Good 3.24 |
| Immigrants | Eritrea | 71.4 /100 | #153 | Good 3.24 |
| Immigrants | Egypt | 70.0 /100 | #154 | Good 3.24 |
| Seminole | 68.2 /100 | #155 | Good 3.24 |
| Immigrants | Taiwan | 68.1 /100 | #156 | Good 3.24 |
| Immigrants | Uzbekistan | 67.0 /100 | #157 | Good 3.24 |