Immigrants from Sweden vs Immigrants from Middle Africa Average Family Size
COMPARE
Immigrants from Sweden
Immigrants from Middle Africa
Average Family Size
Average Family Size Comparison
Immigrants from Sweden
Immigrants from Middle Africa
3.14
AVERAGE FAMILY SIZE
0.2/ 100
METRIC RATING
300th/ 347
METRIC RANK
3.25
AVERAGE FAMILY SIZE
82.4/ 100
METRIC RATING
137th/ 347
METRIC RANK
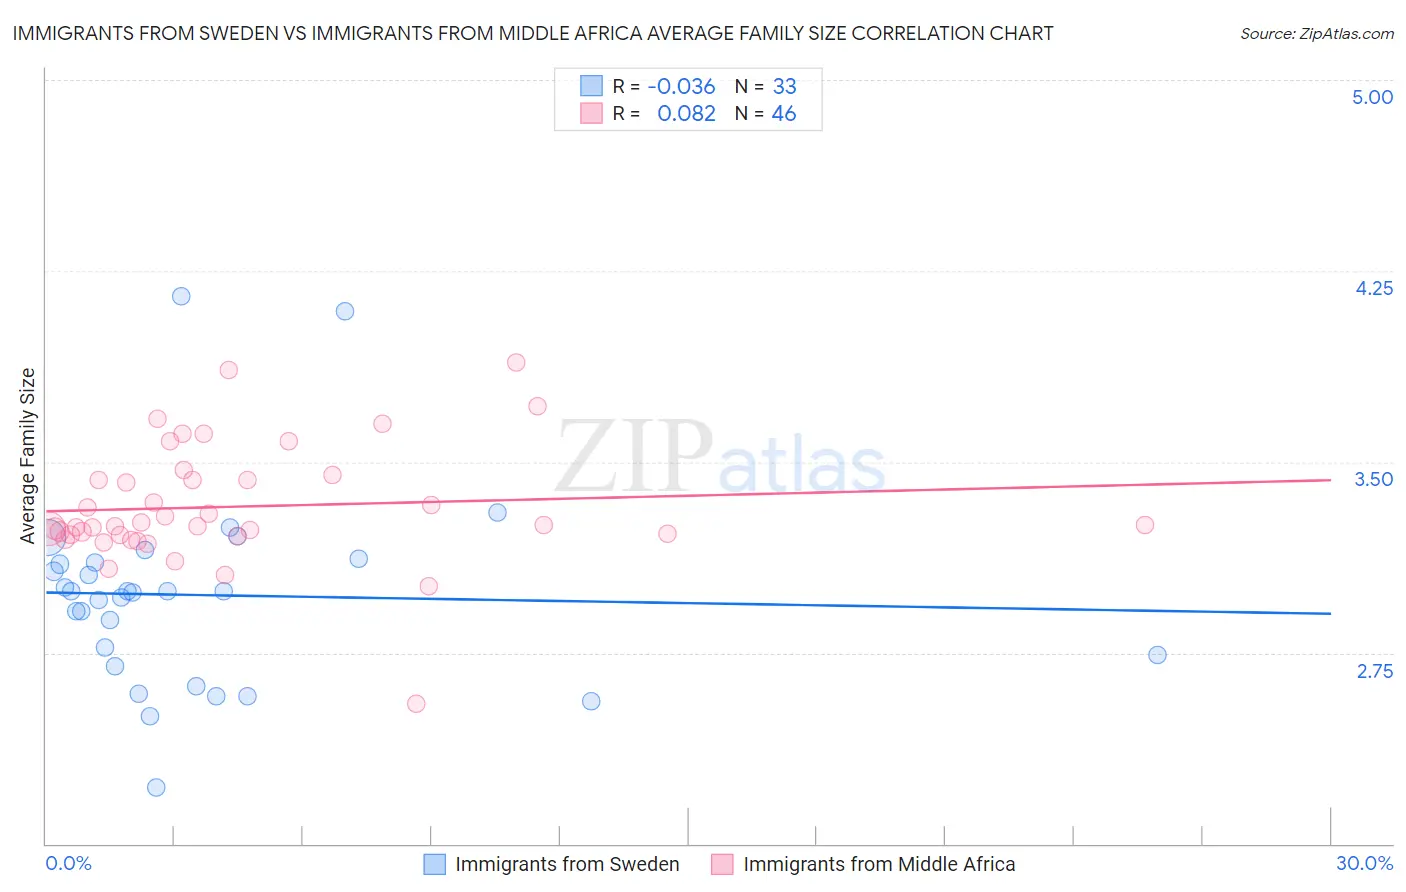
Immigrants from Sweden vs Immigrants from Middle Africa Average Family Size Correlation Chart
The statistical analysis conducted on geographies consisting of 164,705,218 people shows no correlation between the proportion of Immigrants from Sweden and average family size in the United States with a correlation coefficient (R) of -0.036 and weighted average of 3.14. Similarly, the statistical analysis conducted on geographies consisting of 202,632,157 people shows a slight positive correlation between the proportion of Immigrants from Middle Africa and average family size in the United States with a correlation coefficient (R) of 0.082 and weighted average of 3.25, a difference of 3.7%.
Average Family Size Correlation Summary
| Measurement | Immigrants from Sweden | Immigrants from Middle Africa |
| Minimum | 2.22 | 2.55 |
| Maximum | 4.15 | 3.89 |
| Range | 1.93 | 1.34 |
| Mean | 2.98 | 3.32 |
| Median | 2.99 | 3.25 |
| Interquartile 25% (IQ1) | 2.72 | 3.21 |
| Interquartile 75% (IQ3) | 3.11 | 3.43 |
| Interquartile Range (IQR) | 0.39 | 0.21 |
| Standard Deviation (Sample) | 0.39 | 0.23 |
| Standard Deviation (Population) | 0.38 | 0.23 |
Similar Demographics by Average Family Size
Demographics Similar to Immigrants from Sweden by Average Family Size
In terms of average family size, the demographic groups most similar to Immigrants from Sweden are Canadian (3.14, a difference of 0.010%), Immigrants from Western Europe (3.14, a difference of 0.060%), Colville (3.14, a difference of 0.060%), Immigrants from Croatia (3.14, a difference of 0.070%), and Austrian (3.14, a difference of 0.070%).
| Demographics | Rating | Rank | Average Family Size |
| Scandinavians | 0.2 /100 | #293 | Tragic 3.14 |
| Immigrants | Croatia | 0.2 /100 | #294 | Tragic 3.14 |
| Austrians | 0.2 /100 | #295 | Tragic 3.14 |
| Ukrainians | 0.2 /100 | #296 | Tragic 3.14 |
| Immigrants | Western Europe | 0.2 /100 | #297 | Tragic 3.14 |
| Colville | 0.2 /100 | #298 | Tragic 3.14 |
| Canadians | 0.2 /100 | #299 | Tragic 3.14 |
| Immigrants | Sweden | 0.2 /100 | #300 | Tragic 3.14 |
| Macedonians | 0.2 /100 | #301 | Tragic 3.13 |
| Immigrants | Latvia | 0.2 /100 | #302 | Tragic 3.13 |
| British | 0.2 /100 | #303 | Tragic 3.13 |
| Immigrants | Switzerland | 0.2 /100 | #304 | Tragic 3.13 |
| Australians | 0.1 /100 | #305 | Tragic 3.13 |
| Immigrants | Ireland | 0.1 /100 | #306 | Tragic 3.13 |
| Immigrants | Serbia | 0.1 /100 | #307 | Tragic 3.13 |
Demographics Similar to Immigrants from Middle Africa by Average Family Size
In terms of average family size, the demographic groups most similar to Immigrants from Middle Africa are Comanche (3.25, a difference of 0.010%), Cuban (3.25, a difference of 0.020%), Immigrants from Ethiopia (3.25, a difference of 0.020%), Subsaharan African (3.25, a difference of 0.020%), and Venezuelan (3.25, a difference of 0.030%).
| Demographics | Rating | Rank | Average Family Size |
| Laotians | 88.5 /100 | #130 | Excellent 3.26 |
| Immigrants | Western Asia | 87.7 /100 | #131 | Excellent 3.26 |
| Costa Ricans | 86.8 /100 | #132 | Excellent 3.26 |
| Immigrants | Venezuela | 86.3 /100 | #133 | Excellent 3.26 |
| Africans | 84.9 /100 | #134 | Excellent 3.25 |
| Panamanians | 84.2 /100 | #135 | Excellent 3.25 |
| Comanche | 82.8 /100 | #136 | Excellent 3.25 |
| Immigrants | Middle Africa | 82.4 /100 | #137 | Excellent 3.25 |
| Cubans | 81.8 /100 | #138 | Excellent 3.25 |
| Immigrants | Ethiopia | 81.6 /100 | #139 | Excellent 3.25 |
| Sub-Saharan Africans | 81.6 /100 | #140 | Excellent 3.25 |
| Venezuelans | 81.4 /100 | #141 | Excellent 3.25 |
| Liberians | 81.2 /100 | #142 | Excellent 3.25 |
| Bhutanese | 81.0 /100 | #143 | Excellent 3.25 |
| Tsimshian | 80.2 /100 | #144 | Excellent 3.25 |