Immigrants from Uzbekistan vs Ghanaian Average Family Size
COMPARE
Immigrants from Uzbekistan
Ghanaian
Average Family Size
Average Family Size Comparison
Immigrants from Uzbekistan
Ghanaians
3.24
AVERAGE FAMILY SIZE
67.0/ 100
METRIC RATING
157th/ 347
METRIC RANK
3.29
AVERAGE FAMILY SIZE
98.0/ 100
METRIC RATING
107th/ 347
METRIC RANK
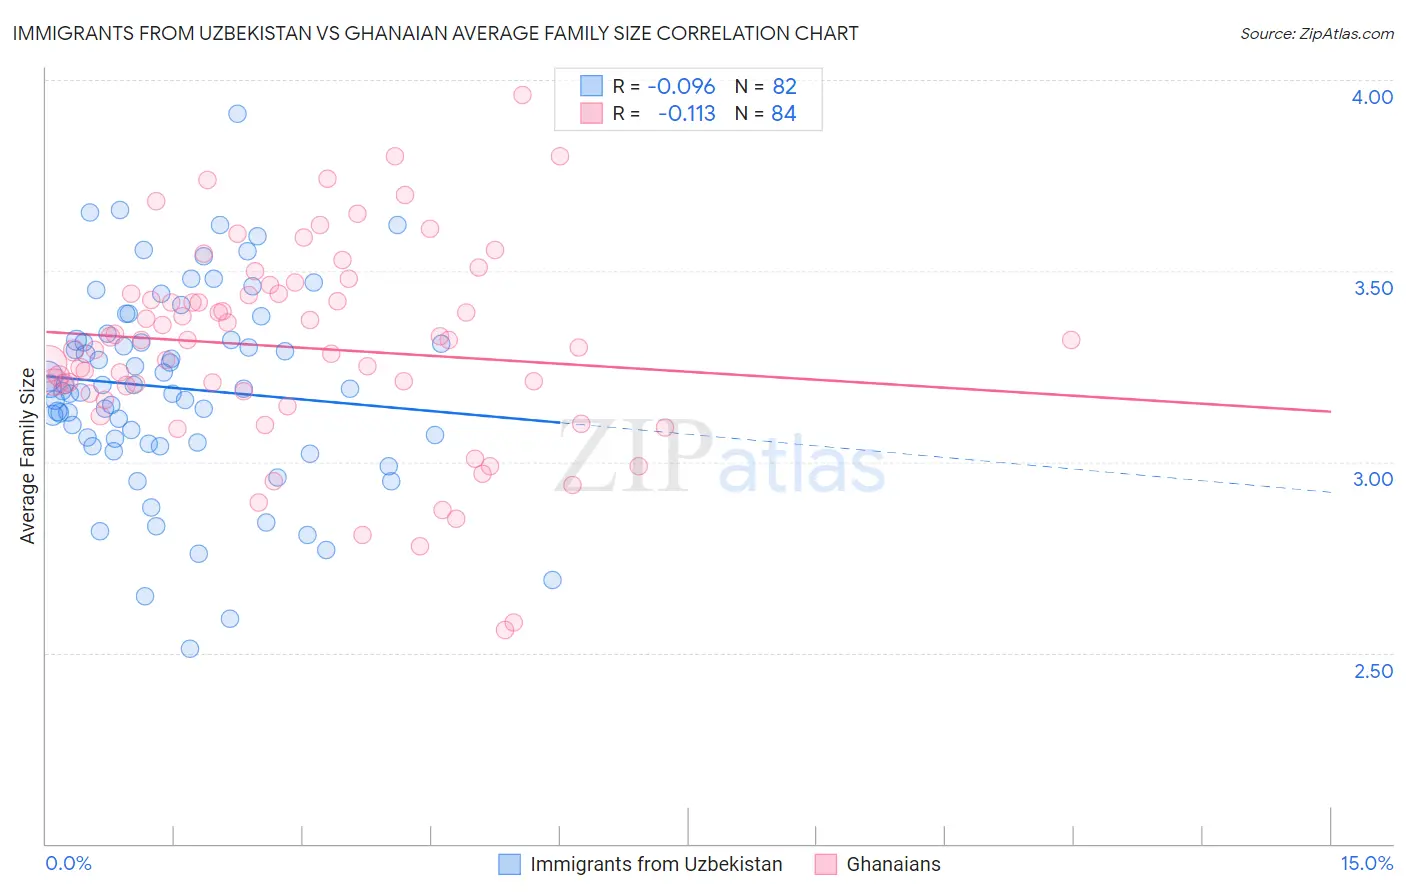
Immigrants from Uzbekistan vs Ghanaian Average Family Size Correlation Chart
The statistical analysis conducted on geographies consisting of 118,722,943 people shows a slight negative correlation between the proportion of Immigrants from Uzbekistan and average family size in the United States with a correlation coefficient (R) of -0.096 and weighted average of 3.24. Similarly, the statistical analysis conducted on geographies consisting of 190,523,422 people shows a poor negative correlation between the proportion of Ghanaians and average family size in the United States with a correlation coefficient (R) of -0.113 and weighted average of 3.29, a difference of 1.4%.
Average Family Size Correlation Summary
| Measurement | Immigrants from Uzbekistan | Ghanaian |
| Minimum | 2.51 | 2.56 |
| Maximum | 3.91 | 3.96 |
| Range | 1.40 | 1.40 |
| Mean | 3.19 | 3.30 |
| Median | 3.19 | 3.32 |
| Interquartile 25% (IQ1) | 3.05 | 3.18 |
| Interquartile 75% (IQ3) | 3.32 | 3.44 |
| Interquartile Range (IQR) | 0.27 | 0.26 |
| Standard Deviation (Sample) | 0.26 | 0.26 |
| Standard Deviation (Population) | 0.26 | 0.26 |
Similar Demographics by Average Family Size
Demographics Similar to Immigrants from Uzbekistan by Average Family Size
In terms of average family size, the demographic groups most similar to Immigrants from Uzbekistan are Seminole (3.24, a difference of 0.020%), Immigrants from Taiwan (3.24, a difference of 0.020%), Iraqi (3.24, a difference of 0.050%), Immigrants from Egypt (3.24, a difference of 0.060%), and Ethiopian (3.24, a difference of 0.060%).
| Demographics | Rating | Rank | Average Family Size |
| Indians (Asian) | 73.6 /100 | #150 | Good 3.24 |
| Jordanians | 73.5 /100 | #151 | Good 3.24 |
| Spanish Americans | 72.5 /100 | #152 | Good 3.24 |
| Immigrants | Eritrea | 71.4 /100 | #153 | Good 3.24 |
| Immigrants | Egypt | 70.0 /100 | #154 | Good 3.24 |
| Seminole | 68.2 /100 | #155 | Good 3.24 |
| Immigrants | Taiwan | 68.1 /100 | #156 | Good 3.24 |
| Immigrants | Uzbekistan | 67.0 /100 | #157 | Good 3.24 |
| Iraqis | 64.3 /100 | #158 | Good 3.24 |
| Ethiopians | 63.9 /100 | #159 | Good 3.24 |
| Immigrants | Iraq | 63.7 /100 | #160 | Good 3.24 |
| Immigrants | Chile | 63.2 /100 | #161 | Good 3.24 |
| Immigrants | Uganda | 60.1 /100 | #162 | Good 3.23 |
| Uruguayans | 58.8 /100 | #163 | Average 3.23 |
| Egyptians | 58.6 /100 | #164 | Average 3.23 |
Demographics Similar to Ghanaians by Average Family Size
In terms of average family size, the demographic groups most similar to Ghanaians are Paiute (3.29, a difference of 0.020%), Immigrants from Ghana (3.29, a difference of 0.030%), Bolivian (3.29, a difference of 0.090%), Immigrants from Western Africa (3.29, a difference of 0.12%), and West Indian (3.29, a difference of 0.15%).
| Demographics | Rating | Rank | Average Family Size |
| Guamanians/Chamorros | 98.6 /100 | #100 | Exceptional 3.29 |
| Immigrants | Burma/Myanmar | 98.6 /100 | #101 | Exceptional 3.29 |
| West Indians | 98.5 /100 | #102 | Exceptional 3.29 |
| Immigrants | Western Africa | 98.4 /100 | #103 | Exceptional 3.29 |
| Bolivians | 98.3 /100 | #104 | Exceptional 3.29 |
| Immigrants | Ghana | 98.1 /100 | #105 | Exceptional 3.29 |
| Paiute | 98.0 /100 | #106 | Exceptional 3.29 |
| Ghanaians | 98.0 /100 | #107 | Exceptional 3.29 |
| Asians | 97.0 /100 | #108 | Exceptional 3.28 |
| Puerto Ricans | 96.7 /100 | #109 | Exceptional 3.28 |
| Bahamians | 96.6 /100 | #110 | Exceptional 3.28 |
| Indonesians | 96.2 /100 | #111 | Exceptional 3.28 |
| Blacks/African Americans | 95.7 /100 | #112 | Exceptional 3.27 |
| Immigrants | Panama | 95.6 /100 | #113 | Exceptional 3.27 |
| South Americans | 95.1 /100 | #114 | Exceptional 3.27 |