Immigrants from North America vs Immigrants from Middle Africa Average Family Size
COMPARE
Immigrants from North America
Immigrants from Middle Africa
Average Family Size
Average Family Size Comparison
Immigrants from North America
Immigrants from Middle Africa
3.12
AVERAGE FAMILY SIZE
0.0/ 100
METRIC RATING
320th/ 347
METRIC RANK
3.25
AVERAGE FAMILY SIZE
82.4/ 100
METRIC RATING
137th/ 347
METRIC RANK
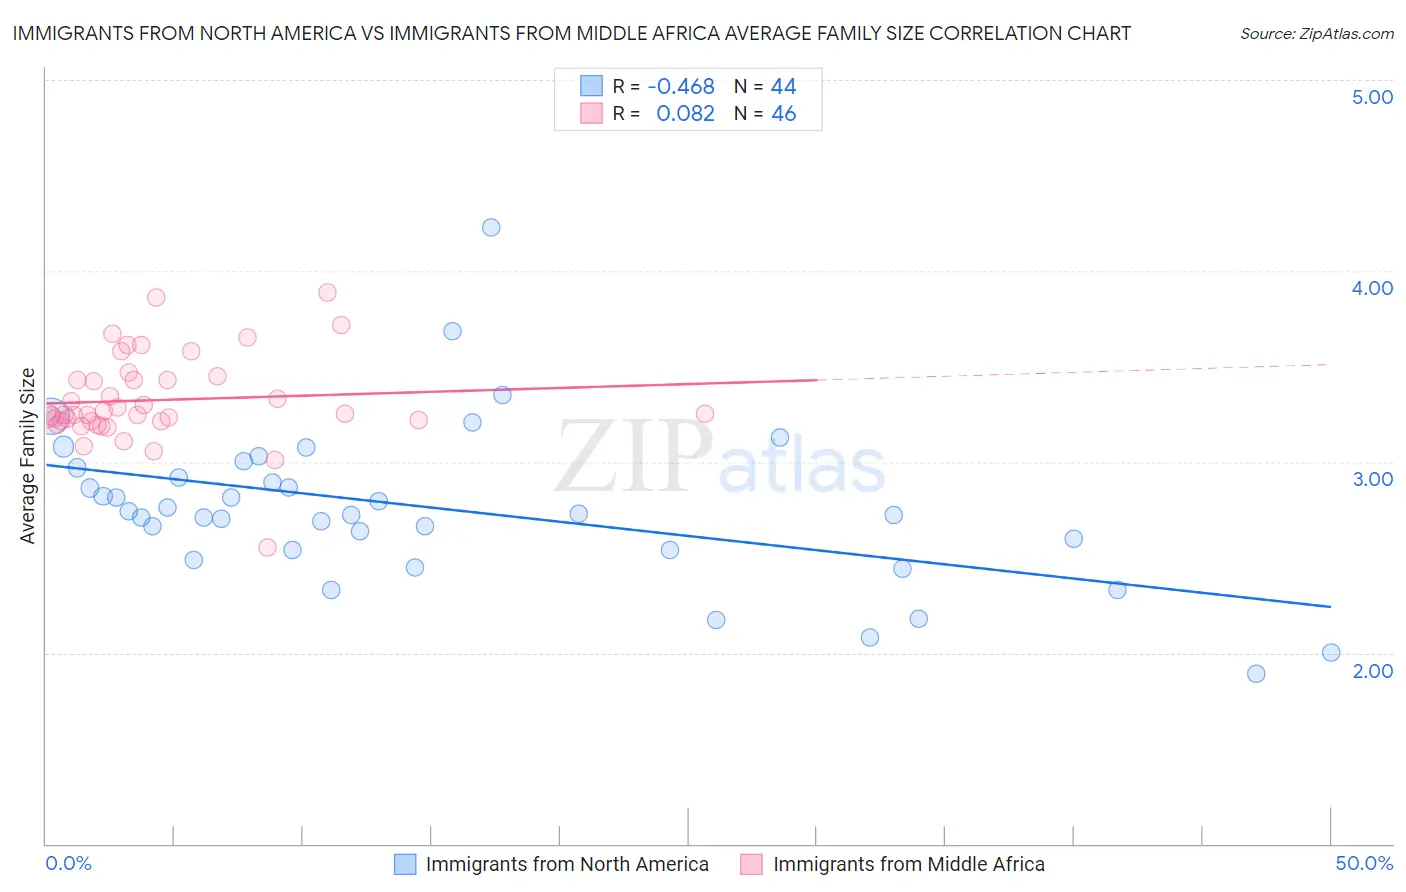
Immigrants from North America vs Immigrants from Middle Africa Average Family Size Correlation Chart
The statistical analysis conducted on geographies consisting of 462,193,145 people shows a moderate negative correlation between the proportion of Immigrants from North America and average family size in the United States with a correlation coefficient (R) of -0.468 and weighted average of 3.12. Similarly, the statistical analysis conducted on geographies consisting of 202,632,157 people shows a slight positive correlation between the proportion of Immigrants from Middle Africa and average family size in the United States with a correlation coefficient (R) of 0.082 and weighted average of 3.25, a difference of 4.3%.
Average Family Size Correlation Summary
| Measurement | Immigrants from North America | Immigrants from Middle Africa |
| Minimum | 1.89 | 2.55 |
| Maximum | 4.23 | 3.89 |
| Range | 2.34 | 1.34 |
| Mean | 2.76 | 3.32 |
| Median | 2.73 | 3.25 |
| Interquartile 25% (IQ1) | 2.54 | 3.21 |
| Interquartile 75% (IQ3) | 2.94 | 3.43 |
| Interquartile Range (IQR) | 0.41 | 0.21 |
| Standard Deviation (Sample) | 0.42 | 0.23 |
| Standard Deviation (Population) | 0.42 | 0.23 |
Similar Demographics by Average Family Size
Demographics Similar to Immigrants from North America by Average Family Size
In terms of average family size, the demographic groups most similar to Immigrants from North America are Immigrants from Austria (3.12, a difference of 0.030%), Immigrants from Canada (3.12, a difference of 0.030%), Soviet Union (3.11, a difference of 0.060%), Eastern European (3.12, a difference of 0.070%), and Welsh (3.12, a difference of 0.070%).
| Demographics | Rating | Rank | Average Family Size |
| Bulgarians | 0.1 /100 | #313 | Tragic 3.13 |
| Russians | 0.1 /100 | #314 | Tragic 3.12 |
| Immigrants | Scotland | 0.1 /100 | #315 | Tragic 3.12 |
| Serbians | 0.1 /100 | #316 | Tragic 3.12 |
| Italians | 0.1 /100 | #317 | Tragic 3.12 |
| Eastern Europeans | 0.1 /100 | #318 | Tragic 3.12 |
| Welsh | 0.1 /100 | #319 | Tragic 3.12 |
| Immigrants | North America | 0.0 /100 | #320 | Tragic 3.12 |
| Immigrants | Austria | 0.0 /100 | #321 | Tragic 3.12 |
| Immigrants | Canada | 0.0 /100 | #322 | Tragic 3.12 |
| Soviet Union | 0.0 /100 | #323 | Tragic 3.11 |
| Celtics | 0.0 /100 | #324 | Tragic 3.11 |
| English | 0.0 /100 | #325 | Tragic 3.11 |
| Ottawa | 0.0 /100 | #326 | Tragic 3.11 |
| Dutch | 0.0 /100 | #327 | Tragic 3.11 |
Demographics Similar to Immigrants from Middle Africa by Average Family Size
In terms of average family size, the demographic groups most similar to Immigrants from Middle Africa are Comanche (3.25, a difference of 0.010%), Cuban (3.25, a difference of 0.020%), Immigrants from Ethiopia (3.25, a difference of 0.020%), Subsaharan African (3.25, a difference of 0.020%), and Venezuelan (3.25, a difference of 0.030%).
| Demographics | Rating | Rank | Average Family Size |
| Laotians | 88.5 /100 | #130 | Excellent 3.26 |
| Immigrants | Western Asia | 87.7 /100 | #131 | Excellent 3.26 |
| Costa Ricans | 86.8 /100 | #132 | Excellent 3.26 |
| Immigrants | Venezuela | 86.3 /100 | #133 | Excellent 3.26 |
| Africans | 84.9 /100 | #134 | Excellent 3.25 |
| Panamanians | 84.2 /100 | #135 | Excellent 3.25 |
| Comanche | 82.8 /100 | #136 | Excellent 3.25 |
| Immigrants | Middle Africa | 82.4 /100 | #137 | Excellent 3.25 |
| Cubans | 81.8 /100 | #138 | Excellent 3.25 |
| Immigrants | Ethiopia | 81.6 /100 | #139 | Excellent 3.25 |
| Sub-Saharan Africans | 81.6 /100 | #140 | Excellent 3.25 |
| Venezuelans | 81.4 /100 | #141 | Excellent 3.25 |
| Liberians | 81.2 /100 | #142 | Excellent 3.25 |
| Bhutanese | 81.0 /100 | #143 | Excellent 3.25 |
| Tsimshian | 80.2 /100 | #144 | Excellent 3.25 |