Immigrants from Bahamas vs Immigrants from Middle Africa Average Family Size
COMPARE
Immigrants from Bahamas
Immigrants from Middle Africa
Average Family Size
Average Family Size Comparison
Immigrants from Bahamas
Immigrants from Middle Africa
3.27
AVERAGE FAMILY SIZE
93.6/ 100
METRIC RATING
120th/ 347
METRIC RANK
3.25
AVERAGE FAMILY SIZE
82.4/ 100
METRIC RATING
137th/ 347
METRIC RANK
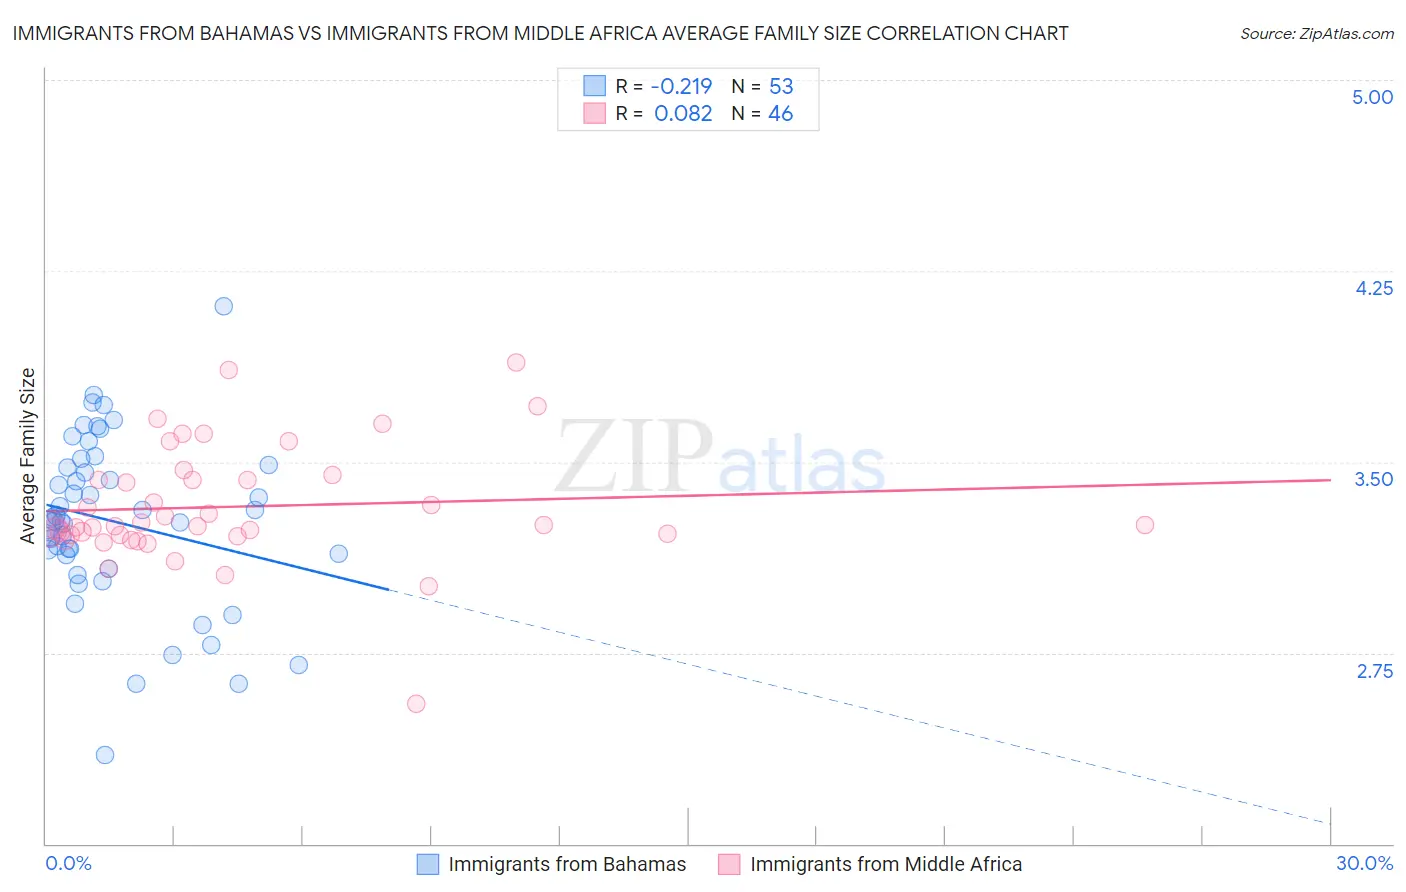
Immigrants from Bahamas vs Immigrants from Middle Africa Average Family Size Correlation Chart
The statistical analysis conducted on geographies consisting of 104,605,008 people shows a weak negative correlation between the proportion of Immigrants from Bahamas and average family size in the United States with a correlation coefficient (R) of -0.219 and weighted average of 3.27. Similarly, the statistical analysis conducted on geographies consisting of 202,632,157 people shows a slight positive correlation between the proportion of Immigrants from Middle Africa and average family size in the United States with a correlation coefficient (R) of 0.082 and weighted average of 3.25, a difference of 0.51%.
Average Family Size Correlation Summary
| Measurement | Immigrants from Bahamas | Immigrants from Middle Africa |
| Minimum | 2.35 | 2.55 |
| Maximum | 4.11 | 3.89 |
| Range | 1.76 | 1.34 |
| Mean | 3.26 | 3.32 |
| Median | 3.27 | 3.25 |
| Interquartile 25% (IQ1) | 3.11 | 3.21 |
| Interquartile 75% (IQ3) | 3.48 | 3.43 |
| Interquartile Range (IQR) | 0.38 | 0.21 |
| Standard Deviation (Sample) | 0.33 | 0.23 |
| Standard Deviation (Population) | 0.33 | 0.23 |
Demographics Similar to Immigrants from Bahamas and Immigrants from Middle Africa by Average Family Size
In terms of average family size, the demographic groups most similar to Immigrants from Bahamas are Immigrants from Indonesia (3.27, a difference of 0.010%), Immigrants from Thailand (3.27, a difference of 0.020%), Immigrants from Asia (3.27, a difference of 0.030%), Immigrants from Colombia (3.27, a difference of 0.060%), and Alaskan Athabascan (3.27, a difference of 0.080%). Similarly, the demographic groups most similar to Immigrants from Middle Africa are Comanche (3.25, a difference of 0.010%), Cuban (3.25, a difference of 0.020%), Panamanian (3.25, a difference of 0.060%), African (3.25, a difference of 0.080%), and Immigrants from Venezuela (3.26, a difference of 0.13%).
| Demographics | Rating | Rank | Average Family Size |
| Immigrants | Asia | 94.0 /100 | #118 | Exceptional 3.27 |
| Immigrants | Indonesia | 93.7 /100 | #119 | Exceptional 3.27 |
| Immigrants | Bahamas | 93.6 /100 | #120 | Exceptional 3.27 |
| Immigrants | Thailand | 93.3 /100 | #121 | Exceptional 3.27 |
| Immigrants | Colombia | 92.8 /100 | #122 | Exceptional 3.27 |
| Alaskan Athabascans | 92.4 /100 | #123 | Exceptional 3.27 |
| South American Indians | 91.6 /100 | #124 | Exceptional 3.26 |
| Immigrants | Cuba | 91.3 /100 | #125 | Exceptional 3.26 |
| Immigrants | Costa Rica | 90.7 /100 | #126 | Exceptional 3.26 |
| Immigrants | Syria | 90.6 /100 | #127 | Exceptional 3.26 |
| Colombians | 89.9 /100 | #128 | Excellent 3.26 |
| Immigrants | Hong Kong | 88.6 /100 | #129 | Excellent 3.26 |
| Laotians | 88.5 /100 | #130 | Excellent 3.26 |
| Immigrants | Western Asia | 87.7 /100 | #131 | Excellent 3.26 |
| Costa Ricans | 86.8 /100 | #132 | Excellent 3.26 |
| Immigrants | Venezuela | 86.3 /100 | #133 | Excellent 3.26 |
| Africans | 84.9 /100 | #134 | Excellent 3.25 |
| Panamanians | 84.2 /100 | #135 | Excellent 3.25 |
| Comanche | 82.8 /100 | #136 | Excellent 3.25 |
| Immigrants | Middle Africa | 82.4 /100 | #137 | Excellent 3.25 |
| Cubans | 81.8 /100 | #138 | Excellent 3.25 |