Immigrants from Uzbekistan vs Immigrants from Middle Africa Associate's Degree
COMPARE
Immigrants from Uzbekistan
Immigrants from Middle Africa
Associate's Degree
Associate's Degree Comparison
Immigrants from Uzbekistan
Immigrants from Middle Africa
50.3%
ASSOCIATE'S DEGREE
98.9/ 100
METRIC RATING
83rd/ 347
METRIC RANK
44.7%
ASSOCIATE'S DEGREE
12.7/ 100
METRIC RATING
214th/ 347
METRIC RANK
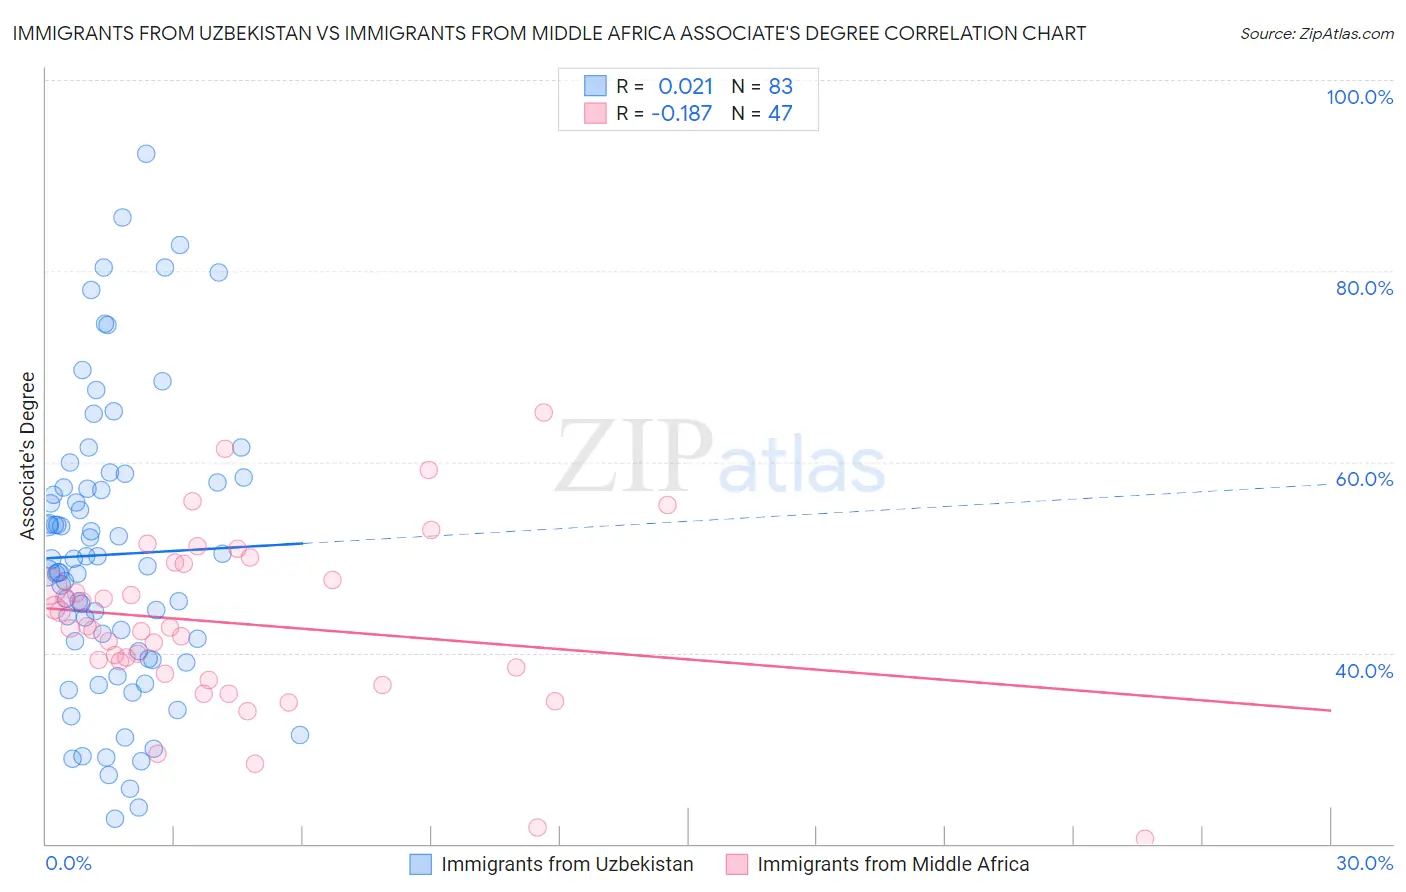
Immigrants from Uzbekistan vs Immigrants from Middle Africa Associate's Degree Correlation Chart
The statistical analysis conducted on geographies consisting of 118,752,495 people shows no correlation between the proportion of Immigrants from Uzbekistan and percentage of population with at least associate's degree education in the United States with a correlation coefficient (R) of 0.021 and weighted average of 50.3%. Similarly, the statistical analysis conducted on geographies consisting of 202,743,953 people shows a poor negative correlation between the proportion of Immigrants from Middle Africa and percentage of population with at least associate's degree education in the United States with a correlation coefficient (R) of -0.187 and weighted average of 44.7%, a difference of 12.5%.
Associate's Degree Correlation Summary
| Measurement | Immigrants from Uzbekistan | Immigrants from Middle Africa |
| Minimum | 22.7% | 20.5% |
| Maximum | 92.3% | 65.2% |
| Range | 69.6% | 44.7% |
| Mean | 50.3% | 43.1% |
| Median | 49.0% | 42.6% |
| Interquartile 25% (IQ1) | 39.4% | 37.8% |
| Interquartile 75% (IQ3) | 57.9% | 49.3% |
| Interquartile Range (IQR) | 18.5% | 11.5% |
| Standard Deviation (Sample) | 15.3% | 9.1% |
| Standard Deviation (Population) | 15.2% | 9.0% |
Similar Demographics by Associate's Degree
Demographics Similar to Immigrants from Uzbekistan by Associate's Degree
In terms of associate's degree, the demographic groups most similar to Immigrants from Uzbekistan are Immigrants from Hungary (50.2%, a difference of 0.020%), Greek (50.3%, a difference of 0.040%), Immigrants from Egypt (50.2%, a difference of 0.070%), Immigrants from Croatia (50.2%, a difference of 0.080%), and Immigrants from Moldova (50.2%, a difference of 0.20%).
| Demographics | Rating | Rank | Associate's Degree |
| Immigrants | Zimbabwe | 99.2 /100 | #76 | Exceptional 50.5% |
| Immigrants | Lebanon | 99.1 /100 | #77 | Exceptional 50.5% |
| Immigrants | Eastern Europe | 99.1 /100 | #78 | Exceptional 50.5% |
| Ethiopians | 99.1 /100 | #79 | Exceptional 50.4% |
| Armenians | 99.1 /100 | #80 | Exceptional 50.4% |
| Maltese | 99.1 /100 | #81 | Exceptional 50.4% |
| Greeks | 98.9 /100 | #82 | Exceptional 50.3% |
| Immigrants | Uzbekistan | 98.9 /100 | #83 | Exceptional 50.3% |
| Immigrants | Hungary | 98.9 /100 | #84 | Exceptional 50.2% |
| Immigrants | Egypt | 98.9 /100 | #85 | Exceptional 50.2% |
| Immigrants | Croatia | 98.9 /100 | #86 | Exceptional 50.2% |
| Immigrants | Moldova | 98.8 /100 | #87 | Exceptional 50.2% |
| Immigrants | Canada | 98.7 /100 | #88 | Exceptional 50.1% |
| Immigrants | Western Europe | 98.7 /100 | #89 | Exceptional 50.1% |
| Immigrants | Ethiopia | 98.7 /100 | #90 | Exceptional 50.1% |
Demographics Similar to Immigrants from Middle Africa by Associate's Degree
In terms of associate's degree, the demographic groups most similar to Immigrants from Middle Africa are Immigrants from Panama (44.7%, a difference of 0.060%), Immigrants from Nigeria (44.6%, a difference of 0.24%), Immigrants from Ghana (44.8%, a difference of 0.25%), French Canadian (44.9%, a difference of 0.38%), and Immigrants (44.5%, a difference of 0.42%).
| Demographics | Rating | Rank | Associate's Degree |
| Panamanians | 18.4 /100 | #207 | Poor 45.1% |
| Dutch | 17.6 /100 | #208 | Poor 45.0% |
| Immigrants | Costa Rica | 16.7 /100 | #209 | Poor 45.0% |
| Immigrants | Philippines | 16.7 /100 | #210 | Poor 45.0% |
| Immigrants | Zaire | 16.6 /100 | #211 | Poor 45.0% |
| French Canadians | 15.0 /100 | #212 | Poor 44.9% |
| Immigrants | Ghana | 14.2 /100 | #213 | Poor 44.8% |
| Immigrants | Middle Africa | 12.7 /100 | #214 | Poor 44.7% |
| Immigrants | Panama | 12.4 /100 | #215 | Poor 44.7% |
| Immigrants | Nigeria | 11.4 /100 | #216 | Poor 44.6% |
| Immigrants | Immigrants | 10.5 /100 | #217 | Poor 44.5% |
| Spanish | 9.4 /100 | #218 | Tragic 44.4% |
| Whites/Caucasians | 7.5 /100 | #219 | Tragic 44.2% |
| Portuguese | 7.2 /100 | #220 | Tragic 44.1% |
| Immigrants | Western Africa | 6.6 /100 | #221 | Tragic 44.1% |