Immigrants from Uruguay vs Moroccan Single Mother Households
COMPARE
Immigrants from Uruguay
Moroccan
Single Mother Households
Single Mother Households Comparison
Immigrants from Uruguay
Moroccans
6.7%
SINGLE MOTHER HOUSEHOLDS
7.9/ 100
METRIC RATING
214th/ 347
METRIC RANK
6.6%
SINGLE MOTHER HOUSEHOLDS
17.4/ 100
METRIC RATING
197th/ 347
METRIC RANK
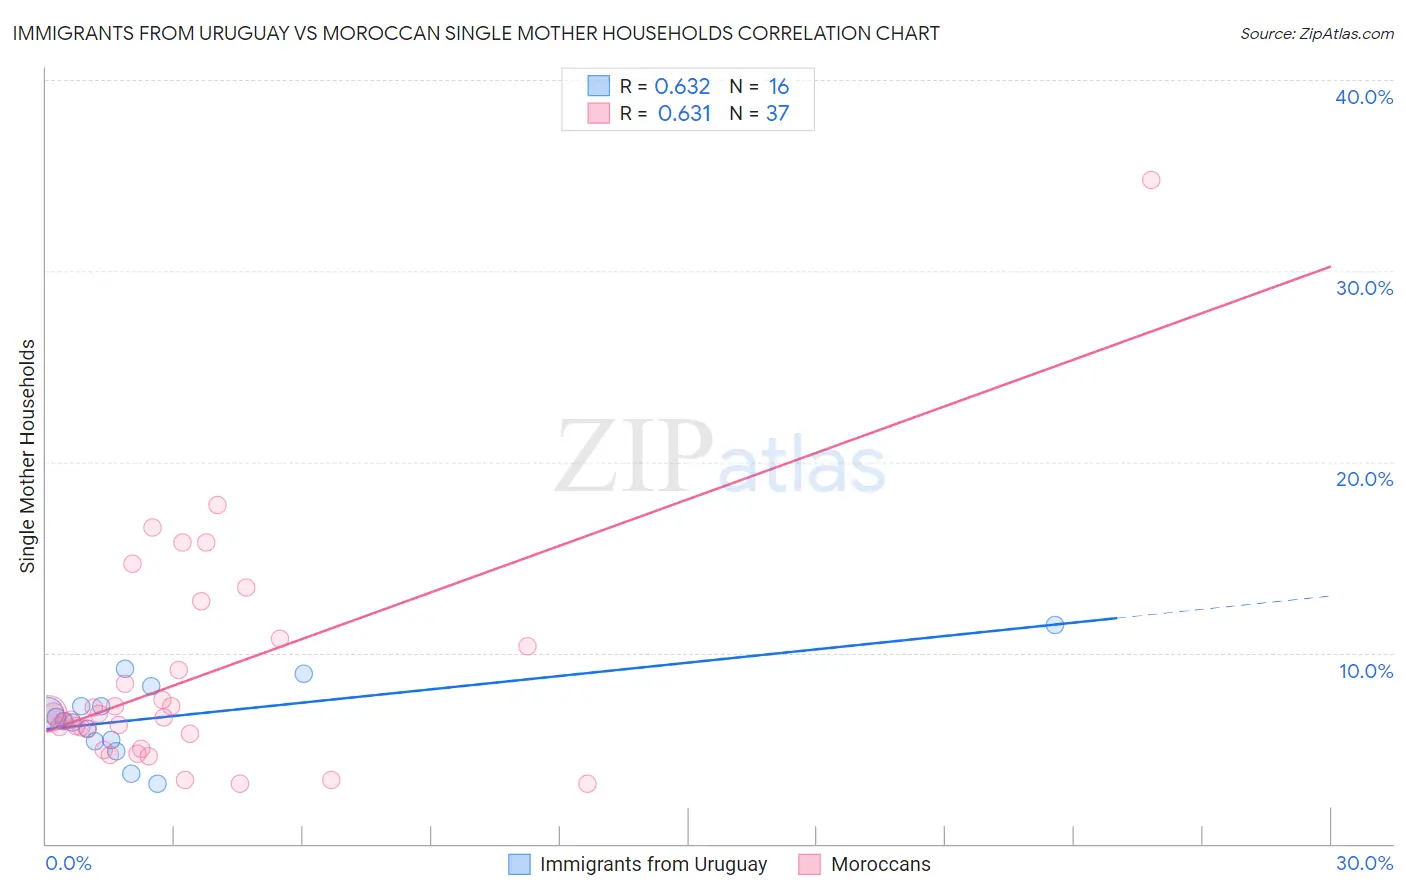
Immigrants from Uruguay vs Moroccan Single Mother Households Correlation Chart
The statistical analysis conducted on geographies consisting of 133,194,023 people shows a significant positive correlation between the proportion of Immigrants from Uruguay and percentage of single mother households in the United States with a correlation coefficient (R) of 0.632 and weighted average of 6.7%. Similarly, the statistical analysis conducted on geographies consisting of 201,586,656 people shows a significant positive correlation between the proportion of Moroccans and percentage of single mother households in the United States with a correlation coefficient (R) of 0.631 and weighted average of 6.6%, a difference of 2.4%.
Single Mother Households Correlation Summary
| Measurement | Immigrants from Uruguay | Moroccan |
| Minimum | 3.1% | 3.1% |
| Maximum | 11.4% | 34.7% |
| Range | 8.3% | 31.6% |
| Mean | 6.7% | 8.7% |
| Median | 6.5% | 6.8% |
| Interquartile 25% (IQ1) | 5.4% | 5.4% |
| Interquartile 75% (IQ3) | 7.7% | 10.6% |
| Interquartile Range (IQR) | 2.3% | 5.2% |
| Standard Deviation (Sample) | 2.1% | 5.9% |
| Standard Deviation (Population) | 2.0% | 5.9% |
Demographics Similar to Immigrants from Uruguay and Moroccans by Single Mother Households
In terms of single mother households, the demographic groups most similar to Immigrants from Uruguay are Immigrants from Costa Rica (6.7%, a difference of 0.11%), Immigrants from Eritrea (6.7%, a difference of 0.16%), Immigrants from Venezuela (6.7%, a difference of 0.22%), Nonimmigrants (6.7%, a difference of 0.80%), and Immigrants from Colombia (6.7%, a difference of 0.82%). Similarly, the demographic groups most similar to Moroccans are South American (6.6%, a difference of 0.11%), Uruguayan (6.6%, a difference of 0.11%), Hawaiian (6.6%, a difference of 0.25%), Potawatomi (6.6%, a difference of 0.36%), and Immigrants from Ethiopia (6.6%, a difference of 0.53%).
| Demographics | Rating | Rank | Single Mother Households |
| South Americans | 18.0 /100 | #195 | Poor 6.6% |
| Uruguayans | 18.0 /100 | #196 | Poor 6.6% |
| Moroccans | 17.4 /100 | #197 | Poor 6.6% |
| Hawaiians | 16.1 /100 | #198 | Poor 6.6% |
| Potawatomi | 15.5 /100 | #199 | Poor 6.6% |
| Immigrants | Ethiopia | 14.7 /100 | #200 | Poor 6.6% |
| Venezuelans | 12.9 /100 | #201 | Poor 6.6% |
| Guamanians/Chamorros | 12.4 /100 | #202 | Poor 6.6% |
| Immigrants | Peru | 12.0 /100 | #203 | Poor 6.7% |
| Immigrants | Fiji | 11.9 /100 | #204 | Poor 6.7% |
| Cree | 11.9 /100 | #205 | Poor 6.7% |
| German Russians | 11.5 /100 | #206 | Poor 6.7% |
| Immigrants | South America | 11.5 /100 | #207 | Poor 6.7% |
| Vietnamese | 11.3 /100 | #208 | Poor 6.7% |
| Immigrants | Colombia | 10.5 /100 | #209 | Poor 6.7% |
| Immigrants | Nonimmigrants | 10.4 /100 | #210 | Poor 6.7% |
| Immigrants | Venezuela | 8.5 /100 | #211 | Tragic 6.7% |
| Immigrants | Eritrea | 8.4 /100 | #212 | Tragic 6.7% |
| Immigrants | Costa Rica | 8.2 /100 | #213 | Tragic 6.7% |
| Immigrants | Uruguay | 7.9 /100 | #214 | Tragic 6.7% |
| Shoshone | 5.7 /100 | #215 | Tragic 6.8% |