Immigrants from Uruguay vs Barbadian Single Mother Households
COMPARE
Immigrants from Uruguay
Barbadian
Single Mother Households
Single Mother Households Comparison
Immigrants from Uruguay
Barbadians
6.7%
SINGLE MOTHER HOUSEHOLDS
7.9/ 100
METRIC RATING
214th/ 347
METRIC RANK
7.9%
SINGLE MOTHER HOUSEHOLDS
0.0/ 100
METRIC RATING
295th/ 347
METRIC RANK
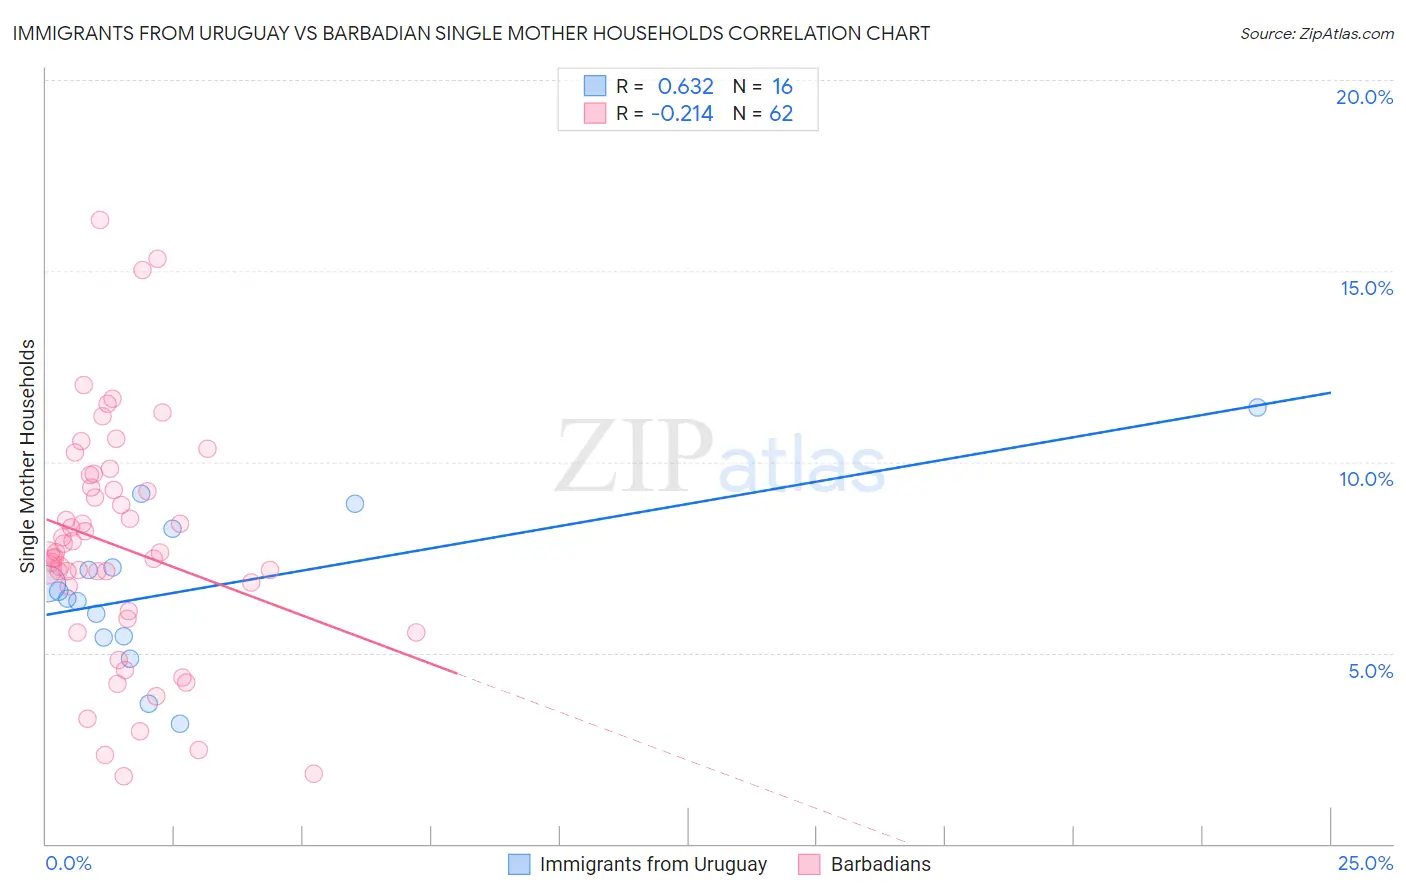
Immigrants from Uruguay vs Barbadian Single Mother Households Correlation Chart
The statistical analysis conducted on geographies consisting of 133,194,023 people shows a significant positive correlation between the proportion of Immigrants from Uruguay and percentage of single mother households in the United States with a correlation coefficient (R) of 0.632 and weighted average of 6.7%. Similarly, the statistical analysis conducted on geographies consisting of 141,217,581 people shows a weak negative correlation between the proportion of Barbadians and percentage of single mother households in the United States with a correlation coefficient (R) of -0.214 and weighted average of 7.9%, a difference of 17.4%.
Single Mother Households Correlation Summary
| Measurement | Immigrants from Uruguay | Barbadian |
| Minimum | 3.1% | 1.8% |
| Maximum | 11.4% | 16.3% |
| Range | 8.3% | 14.6% |
| Mean | 6.7% | 7.8% |
| Median | 6.5% | 7.6% |
| Interquartile 25% (IQ1) | 5.4% | 6.1% |
| Interquartile 75% (IQ3) | 7.7% | 9.3% |
| Interquartile Range (IQR) | 2.3% | 3.2% |
| Standard Deviation (Sample) | 2.1% | 3.1% |
| Standard Deviation (Population) | 2.0% | 3.0% |
Similar Demographics by Single Mother Households
Demographics Similar to Immigrants from Uruguay by Single Mother Households
In terms of single mother households, the demographic groups most similar to Immigrants from Uruguay are Immigrants from Costa Rica (6.7%, a difference of 0.11%), Immigrants from Eritrea (6.7%, a difference of 0.16%), Immigrants from Venezuela (6.7%, a difference of 0.22%), Nonimmigrants (6.7%, a difference of 0.80%), and Immigrants from Colombia (6.7%, a difference of 0.82%).
| Demographics | Rating | Rank | Single Mother Households |
| Immigrants | South America | 11.5 /100 | #207 | Poor 6.7% |
| Vietnamese | 11.3 /100 | #208 | Poor 6.7% |
| Immigrants | Colombia | 10.5 /100 | #209 | Poor 6.7% |
| Immigrants | Nonimmigrants | 10.4 /100 | #210 | Poor 6.7% |
| Immigrants | Venezuela | 8.5 /100 | #211 | Tragic 6.7% |
| Immigrants | Eritrea | 8.4 /100 | #212 | Tragic 6.7% |
| Immigrants | Costa Rica | 8.2 /100 | #213 | Tragic 6.7% |
| Immigrants | Uruguay | 7.9 /100 | #214 | Tragic 6.7% |
| Shoshone | 5.7 /100 | #215 | Tragic 6.8% |
| Cherokee | 5.1 /100 | #216 | Tragic 6.8% |
| Aleuts | 4.8 /100 | #217 | Tragic 6.8% |
| Immigrants | Eastern Africa | 4.4 /100 | #218 | Tragic 6.8% |
| Immigrants | Immigrants | 4.3 /100 | #219 | Tragic 6.8% |
| Immigrants | Thailand | 4.0 /100 | #220 | Tragic 6.9% |
| French American Indians | 3.7 /100 | #221 | Tragic 6.9% |
Demographics Similar to Barbadians by Single Mother Households
In terms of single mother households, the demographic groups most similar to Barbadians are Immigrants from Latin America (7.9%, a difference of 0.060%), Hispanic or Latino (7.9%, a difference of 0.10%), Immigrants from West Indies (7.9%, a difference of 0.22%), Apache (7.9%, a difference of 0.29%), and Houma (7.9%, a difference of 0.30%).
| Demographics | Rating | Rank | Single Mother Households |
| Sierra Leoneans | 0.0 /100 | #288 | Tragic 7.7% |
| Sub-Saharan Africans | 0.0 /100 | #289 | Tragic 7.8% |
| Immigrants | Nigeria | 0.0 /100 | #290 | Tragic 7.8% |
| West Indians | 0.0 /100 | #291 | Tragic 7.8% |
| Ghanaians | 0.0 /100 | #292 | Tragic 7.8% |
| Immigrants | Cameroon | 0.0 /100 | #293 | Tragic 7.9% |
| Apache | 0.0 /100 | #294 | Tragic 7.9% |
| Barbadians | 0.0 /100 | #295 | Tragic 7.9% |
| Immigrants | Latin America | 0.0 /100 | #296 | Tragic 7.9% |
| Hispanics or Latinos | 0.0 /100 | #297 | Tragic 7.9% |
| Immigrants | West Indies | 0.0 /100 | #298 | Tragic 7.9% |
| Houma | 0.0 /100 | #299 | Tragic 7.9% |
| Mexicans | 0.0 /100 | #300 | Tragic 8.0% |
| Chippewa | 0.0 /100 | #301 | Tragic 8.0% |
| Immigrants | Ghana | 0.0 /100 | #302 | Tragic 8.0% |