Immigrants from Uruguay vs Marshallese Average Family Size
COMPARE
Immigrants from Uruguay
Marshallese
Average Family Size
Average Family Size Comparison
Immigrants from Uruguay
Marshallese
3.23
AVERAGE FAMILY SIZE
52.0/ 100
METRIC RATING
173rd/ 347
METRIC RANK
3.38
AVERAGE FAMILY SIZE
100.0/ 100
METRIC RATING
41st/ 347
METRIC RANK
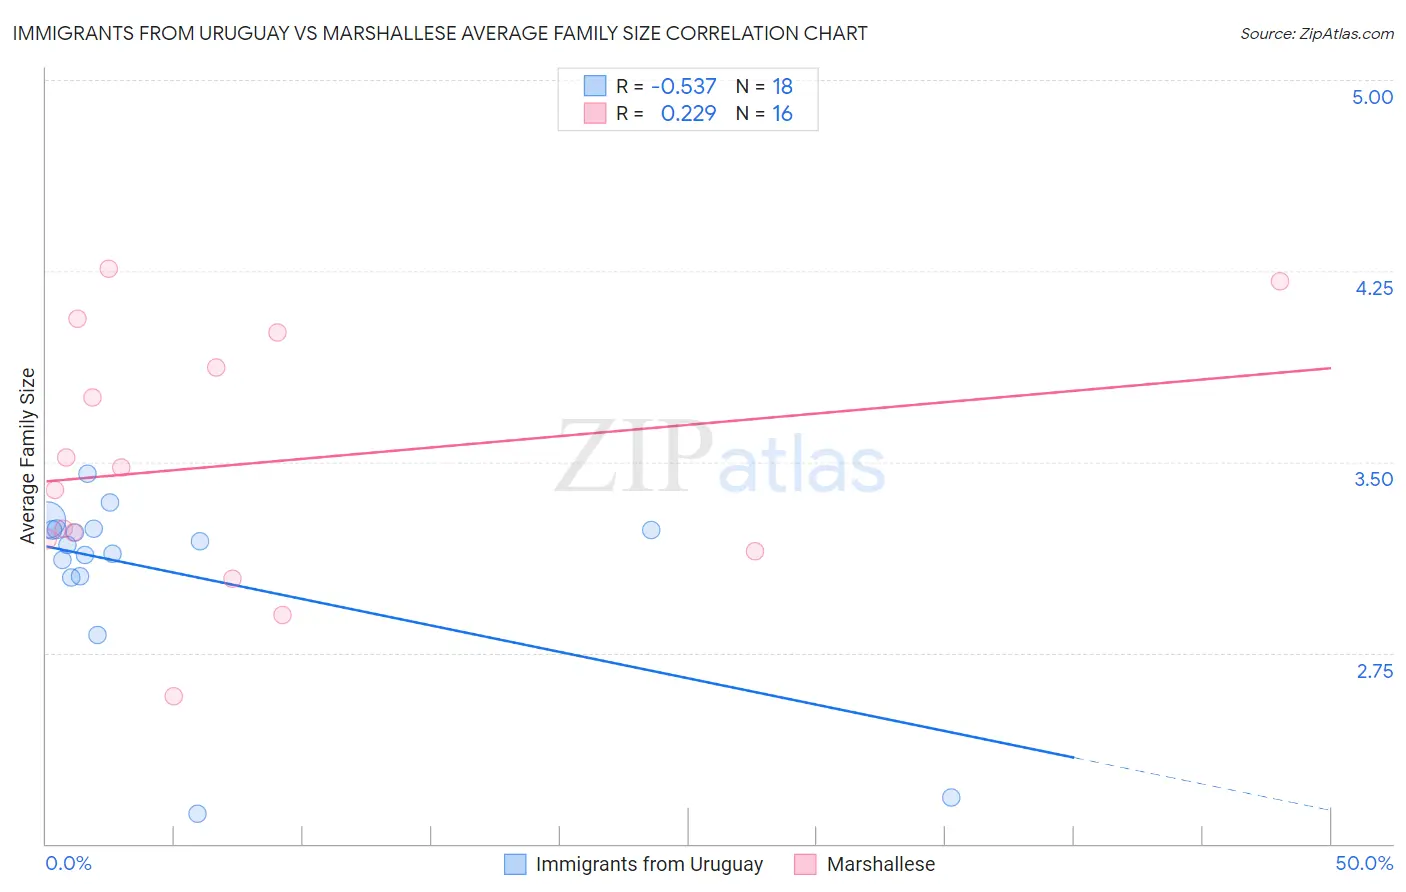
Immigrants from Uruguay vs Marshallese Average Family Size Correlation Chart
The statistical analysis conducted on geographies consisting of 133,245,142 people shows a substantial negative correlation between the proportion of Immigrants from Uruguay and average family size in the United States with a correlation coefficient (R) of -0.537 and weighted average of 3.23. Similarly, the statistical analysis conducted on geographies consisting of 14,761,315 people shows a weak positive correlation between the proportion of Marshallese and average family size in the United States with a correlation coefficient (R) of 0.229 and weighted average of 3.38, a difference of 4.7%.
Average Family Size Correlation Summary
| Measurement | Immigrants from Uruguay | Marshallese |
| Minimum | 2.12 | 2.58 |
| Maximum | 3.46 | 4.26 |
| Range | 1.34 | 1.68 |
| Mean | 3.07 | 3.49 |
| Median | 3.18 | 3.43 |
| Interquartile 25% (IQ1) | 3.05 | 3.17 |
| Interquartile 75% (IQ3) | 3.24 | 3.94 |
| Interquartile Range (IQR) | 0.19 | 0.76 |
| Standard Deviation (Sample) | 0.36 | 0.49 |
| Standard Deviation (Population) | 0.35 | 0.48 |
Similar Demographics by Average Family Size
Demographics Similar to Immigrants from Uruguay by Average Family Size
In terms of average family size, the demographic groups most similar to Immigrants from Uruguay are Immigrants from Congo (3.23, a difference of 0.010%), Chilean (3.23, a difference of 0.020%), Arab (3.23, a difference of 0.030%), Taiwanese (3.23, a difference of 0.040%), and Aleut (3.23, a difference of 0.040%).
| Demographics | Rating | Rank | Average Family Size |
| Immigrants | Senegal | 57.5 /100 | #166 | Average 3.23 |
| Dutch West Indians | 56.9 /100 | #167 | Average 3.23 |
| Taiwanese | 54.2 /100 | #168 | Average 3.23 |
| Aleuts | 54.1 /100 | #169 | Average 3.23 |
| Arabs | 53.8 /100 | #170 | Average 3.23 |
| Chileans | 53.2 /100 | #171 | Average 3.23 |
| Immigrants | Congo | 52.7 /100 | #172 | Average 3.23 |
| Immigrants | Uruguay | 52.0 /100 | #173 | Average 3.23 |
| Immigrants | South Central Asia | 50.0 /100 | #174 | Average 3.23 |
| Immigrants | China | 49.9 /100 | #175 | Average 3.23 |
| Israelis | 48.7 /100 | #176 | Average 3.23 |
| Argentineans | 47.4 /100 | #177 | Average 3.23 |
| Spaniards | 47.2 /100 | #178 | Average 3.23 |
| Immigrants | Korea | 46.9 /100 | #179 | Average 3.23 |
| Palestinians | 46.6 /100 | #180 | Average 3.23 |
Demographics Similar to Marshallese by Average Family Size
In terms of average family size, the demographic groups most similar to Marshallese are Immigrants from Vietnam (3.38, a difference of 0.060%), Immigrants from Philippines (3.37, a difference of 0.16%), Belizean (3.39, a difference of 0.17%), Alaska Native (3.37, a difference of 0.17%), and Shoshone (3.37, a difference of 0.20%).
| Demographics | Rating | Rank | Average Family Size |
| Hispanics or Latinos | 100.0 /100 | #34 | Exceptional 3.41 |
| Guatemalans | 100.0 /100 | #35 | Exceptional 3.40 |
| Immigrants | Guyana | 100.0 /100 | #36 | Exceptional 3.40 |
| Guyanese | 100.0 /100 | #37 | Exceptional 3.40 |
| Immigrants | Belize | 100.0 /100 | #38 | Exceptional 3.39 |
| Immigrants | Haiti | 100.0 /100 | #39 | Exceptional 3.39 |
| Belizeans | 100.0 /100 | #40 | Exceptional 3.39 |
| Marshallese | 100.0 /100 | #41 | Exceptional 3.38 |
| Immigrants | Vietnam | 100.0 /100 | #42 | Exceptional 3.38 |
| Immigrants | Philippines | 100.0 /100 | #43 | Exceptional 3.37 |
| Alaska Natives | 100.0 /100 | #44 | Exceptional 3.37 |
| Shoshone | 100.0 /100 | #45 | Exceptional 3.37 |
| Haitians | 100.0 /100 | #46 | Exceptional 3.37 |
| Vietnamese | 100.0 /100 | #47 | Exceptional 3.37 |
| Immigrants | Nicaragua | 100.0 /100 | #48 | Exceptional 3.37 |