Korean vs Comanche Average Family Size
COMPARE
Korean
Comanche
Average Family Size
Average Family Size Comparison
Koreans
Comanche
3.36
AVERAGE FAMILY SIZE
100.0/ 100
METRIC RATING
53rd/ 347
METRIC RANK
3.25
AVERAGE FAMILY SIZE
82.8/ 100
METRIC RATING
136th/ 347
METRIC RANK
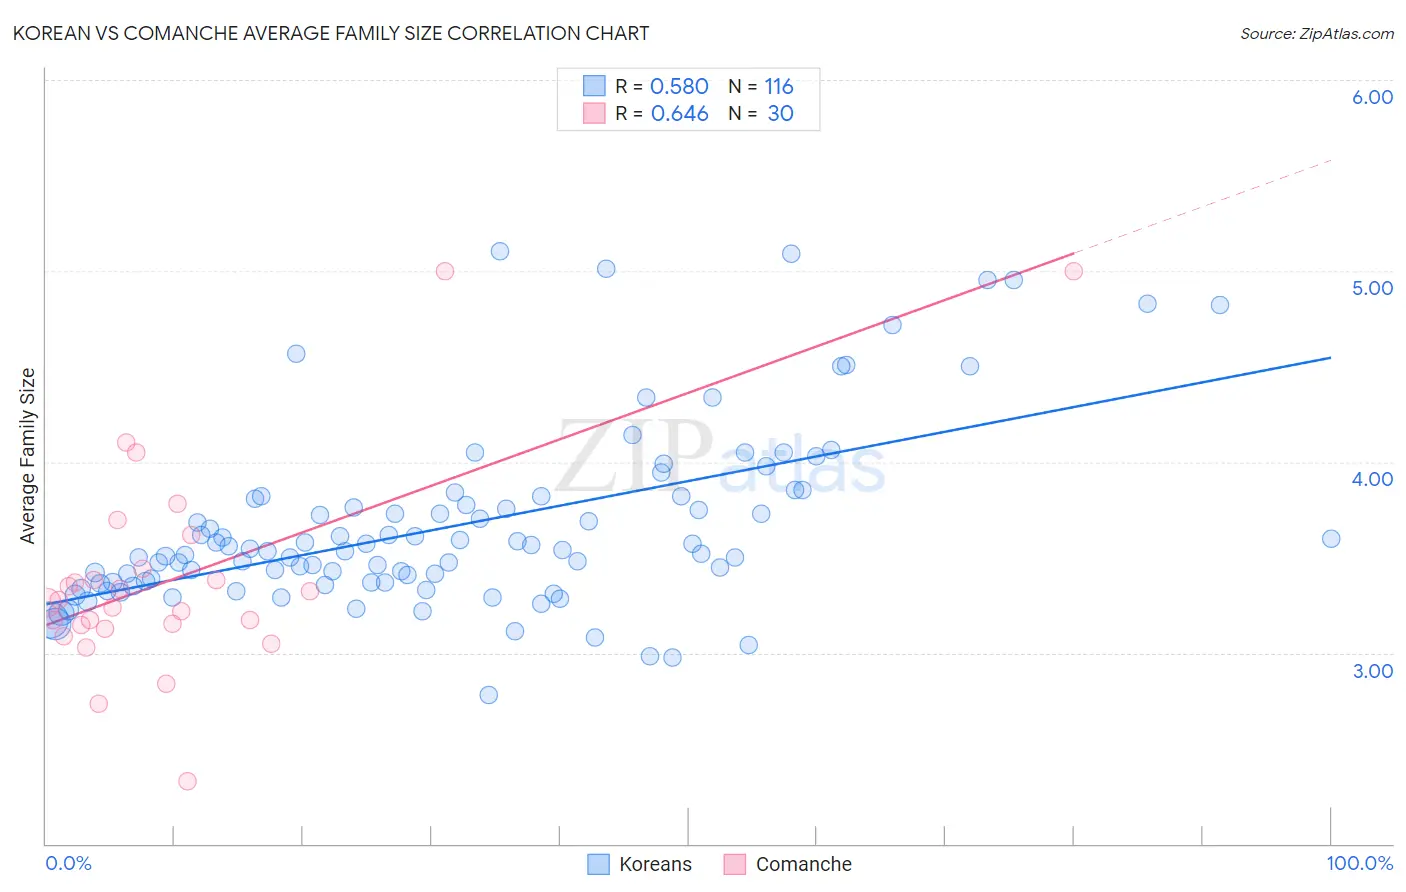
Korean vs Comanche Average Family Size Correlation Chart
The statistical analysis conducted on geographies consisting of 510,405,149 people shows a substantial positive correlation between the proportion of Koreans and average family size in the United States with a correlation coefficient (R) of 0.580 and weighted average of 3.36. Similarly, the statistical analysis conducted on geographies consisting of 109,768,094 people shows a significant positive correlation between the proportion of Comanche and average family size in the United States with a correlation coefficient (R) of 0.646 and weighted average of 3.25, a difference of 3.3%.
Average Family Size Correlation Summary
| Measurement | Korean | Comanche |
| Minimum | 2.78 | 2.33 |
| Maximum | 5.10 | 5.00 |
| Range | 2.32 | 2.67 |
| Mean | 3.66 | 3.39 |
| Median | 3.54 | 3.27 |
| Interquartile 25% (IQ1) | 3.37 | 3.14 |
| Interquartile 75% (IQ3) | 3.81 | 3.44 |
| Interquartile Range (IQR) | 0.45 | 0.30 |
| Standard Deviation (Sample) | 0.47 | 0.56 |
| Standard Deviation (Population) | 0.47 | 0.55 |
Similar Demographics by Average Family Size
Demographics Similar to Koreans by Average Family Size
In terms of average family size, the demographic groups most similar to Koreans are Immigrants from South Eastern Asia (3.36, a difference of 0.020%), Fijian (3.36, a difference of 0.030%), Immigrants from Honduras (3.36, a difference of 0.060%), Nicaraguan (3.36, a difference of 0.090%), and Immigrants from Dominican Republic (3.35, a difference of 0.12%).
| Demographics | Rating | Rank | Average Family Size |
| Haitians | 100.0 /100 | #46 | Exceptional 3.37 |
| Vietnamese | 100.0 /100 | #47 | Exceptional 3.37 |
| Immigrants | Nicaragua | 100.0 /100 | #48 | Exceptional 3.37 |
| Bangladeshis | 100.0 /100 | #49 | Exceptional 3.37 |
| Immigrants | Bangladesh | 100.0 /100 | #50 | Exceptional 3.36 |
| Nicaraguans | 100.0 /100 | #51 | Exceptional 3.36 |
| Fijians | 100.0 /100 | #52 | Exceptional 3.36 |
| Koreans | 100.0 /100 | #53 | Exceptional 3.36 |
| Immigrants | South Eastern Asia | 100.0 /100 | #54 | Exceptional 3.36 |
| Immigrants | Honduras | 100.0 /100 | #55 | Exceptional 3.36 |
| Immigrants | Dominican Republic | 100.0 /100 | #56 | Exceptional 3.35 |
| Sri Lankans | 100.0 /100 | #57 | Exceptional 3.35 |
| Hondurans | 100.0 /100 | #58 | Exceptional 3.35 |
| Japanese | 100.0 /100 | #59 | Exceptional 3.35 |
| Immigrants | Armenia | 100.0 /100 | #60 | Exceptional 3.35 |
Demographics Similar to Comanche by Average Family Size
In terms of average family size, the demographic groups most similar to Comanche are Immigrants from Middle Africa (3.25, a difference of 0.010%), Cuban (3.25, a difference of 0.030%), Immigrants from Ethiopia (3.25, a difference of 0.040%), Subsaharan African (3.25, a difference of 0.040%), and Venezuelan (3.25, a difference of 0.040%).
| Demographics | Rating | Rank | Average Family Size |
| Immigrants | Hong Kong | 88.6 /100 | #129 | Excellent 3.26 |
| Laotians | 88.5 /100 | #130 | Excellent 3.26 |
| Immigrants | Western Asia | 87.7 /100 | #131 | Excellent 3.26 |
| Costa Ricans | 86.8 /100 | #132 | Excellent 3.26 |
| Immigrants | Venezuela | 86.3 /100 | #133 | Excellent 3.26 |
| Africans | 84.9 /100 | #134 | Excellent 3.25 |
| Panamanians | 84.2 /100 | #135 | Excellent 3.25 |
| Comanche | 82.8 /100 | #136 | Excellent 3.25 |
| Immigrants | Middle Africa | 82.4 /100 | #137 | Excellent 3.25 |
| Cubans | 81.8 /100 | #138 | Excellent 3.25 |
| Immigrants | Ethiopia | 81.6 /100 | #139 | Excellent 3.25 |
| Sub-Saharan Africans | 81.6 /100 | #140 | Excellent 3.25 |
| Venezuelans | 81.4 /100 | #141 | Excellent 3.25 |
| Liberians | 81.2 /100 | #142 | Excellent 3.25 |
| Bhutanese | 81.0 /100 | #143 | Excellent 3.25 |