Spanish American vs Comanche Average Family Size
COMPARE
Spanish American
Comanche
Average Family Size
Average Family Size Comparison
Spanish Americans
Comanche
3.24
AVERAGE FAMILY SIZE
72.5/ 100
METRIC RATING
152nd/ 347
METRIC RANK
3.25
AVERAGE FAMILY SIZE
82.8/ 100
METRIC RATING
136th/ 347
METRIC RANK
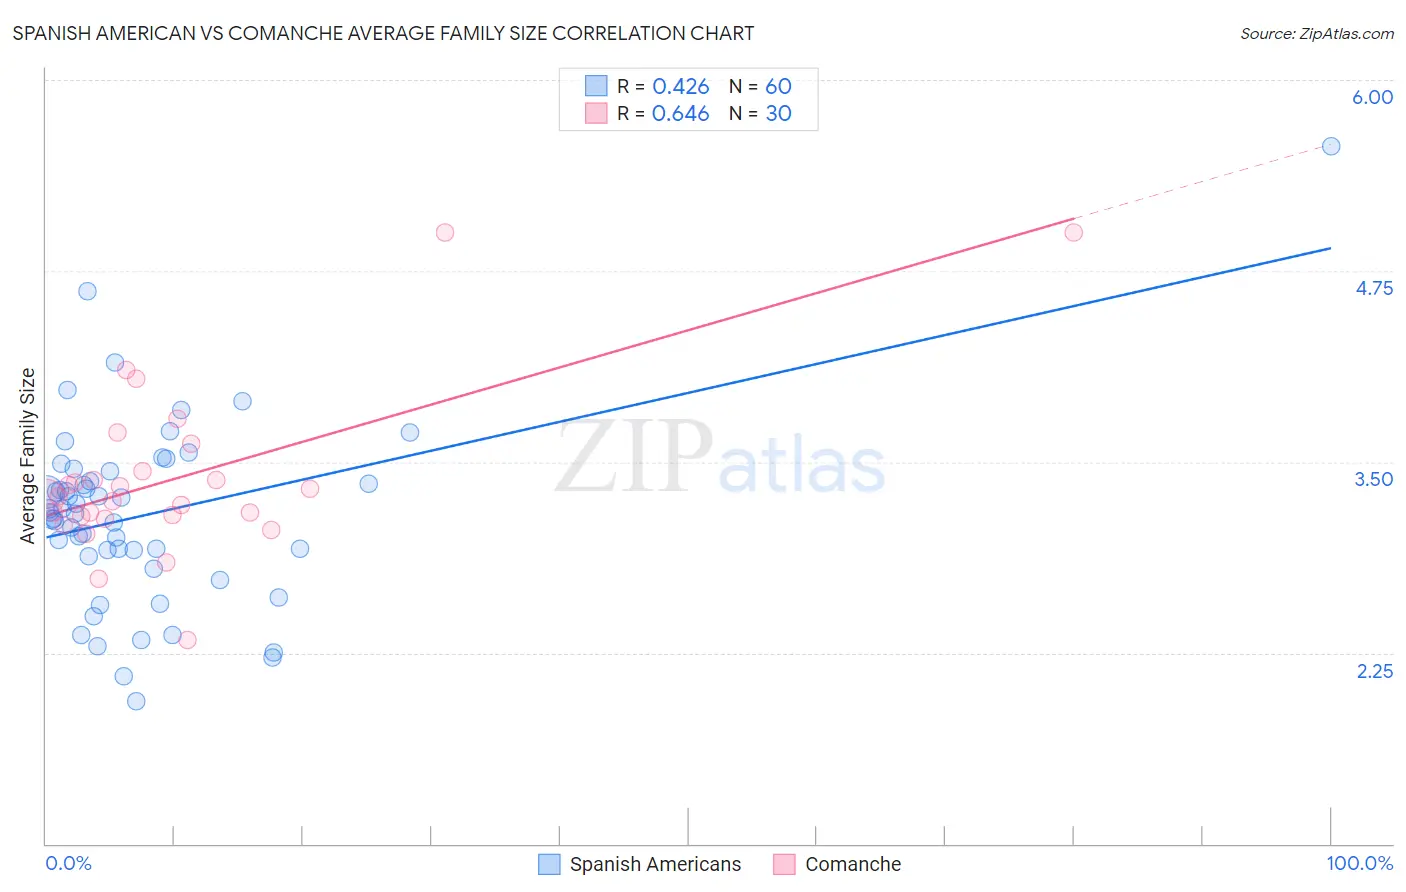
Spanish American vs Comanche Average Family Size Correlation Chart
The statistical analysis conducted on geographies consisting of 103,168,621 people shows a moderate positive correlation between the proportion of Spanish Americans and average family size in the United States with a correlation coefficient (R) of 0.426 and weighted average of 3.24. Similarly, the statistical analysis conducted on geographies consisting of 109,768,094 people shows a significant positive correlation between the proportion of Comanche and average family size in the United States with a correlation coefficient (R) of 0.646 and weighted average of 3.25, a difference of 0.27%.
Average Family Size Correlation Summary
| Measurement | Spanish American | Comanche |
| Minimum | 1.93 | 2.33 |
| Maximum | 5.56 | 5.00 |
| Range | 3.63 | 2.67 |
| Mean | 3.15 | 3.39 |
| Median | 3.17 | 3.27 |
| Interquartile 25% (IQ1) | 2.90 | 3.14 |
| Interquartile 75% (IQ3) | 3.41 | 3.44 |
| Interquartile Range (IQR) | 0.51 | 0.30 |
| Standard Deviation (Sample) | 0.61 | 0.56 |
| Standard Deviation (Population) | 0.60 | 0.55 |
Demographics Similar to Spanish Americans and Comanche by Average Family Size
In terms of average family size, the demographic groups most similar to Spanish Americans are Jordanian (3.24, a difference of 0.020%), Immigrants from Eritrea (3.24, a difference of 0.020%), Assyrian/Chaldean/Syriac (3.24, a difference of 0.030%), Indian (Asian) (3.24, a difference of 0.030%), and Blackfeet (3.24, a difference of 0.060%). Similarly, the demographic groups most similar to Comanche are Immigrants from Middle Africa (3.25, a difference of 0.010%), Cuban (3.25, a difference of 0.030%), Immigrants from Ethiopia (3.25, a difference of 0.040%), Subsaharan African (3.25, a difference of 0.040%), and Venezuelan (3.25, a difference of 0.040%).
| Demographics | Rating | Rank | Average Family Size |
| Africans | 84.9 /100 | #134 | Excellent 3.25 |
| Panamanians | 84.2 /100 | #135 | Excellent 3.25 |
| Comanche | 82.8 /100 | #136 | Excellent 3.25 |
| Immigrants | Middle Africa | 82.4 /100 | #137 | Excellent 3.25 |
| Cubans | 81.8 /100 | #138 | Excellent 3.25 |
| Immigrants | Ethiopia | 81.6 /100 | #139 | Excellent 3.25 |
| Sub-Saharan Africans | 81.6 /100 | #140 | Excellent 3.25 |
| Venezuelans | 81.4 /100 | #141 | Excellent 3.25 |
| Liberians | 81.2 /100 | #142 | Excellent 3.25 |
| Bhutanese | 81.0 /100 | #143 | Excellent 3.25 |
| Tsimshian | 80.2 /100 | #144 | Excellent 3.25 |
| Armenians | 78.2 /100 | #145 | Good 3.25 |
| Immigrants | Africa | 77.9 /100 | #146 | Good 3.25 |
| Immigrants | Jordan | 75.7 /100 | #147 | Good 3.24 |
| Blackfeet | 75.0 /100 | #148 | Good 3.24 |
| Assyrians/Chaldeans/Syriacs | 73.8 /100 | #149 | Good 3.24 |
| Indians (Asian) | 73.6 /100 | #150 | Good 3.24 |
| Jordanians | 73.5 /100 | #151 | Good 3.24 |
| Spanish Americans | 72.5 /100 | #152 | Good 3.24 |
| Immigrants | Eritrea | 71.4 /100 | #153 | Good 3.24 |
| Immigrants | Egypt | 70.0 /100 | #154 | Good 3.24 |